PENNEY INTERMEDIATE HOLDINGS LLC Consolidated Financial Statements (Unaudited) August 3, 2024 and July 29, 2023 1

NARRATIVE REPORT & FINANCIALS (follows this page)
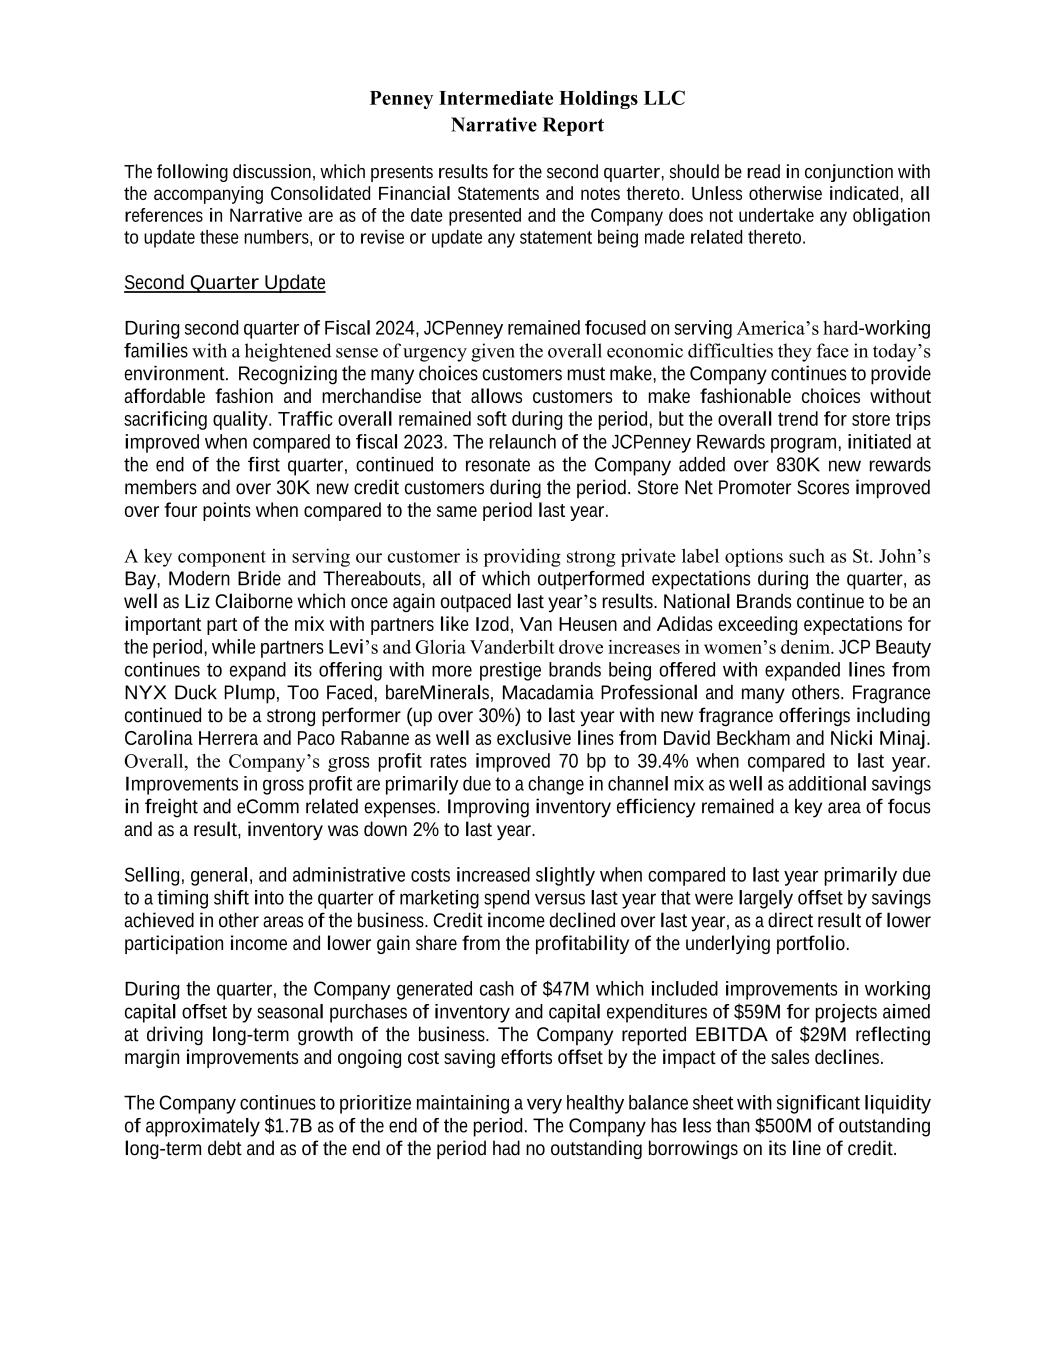
Penney Intermediate Holdings LLC Narrative Report The following discussion, which presents results for the second quarter, should be read in conjunction with the accompanying Consolidated Financial Statements and notes thereto. Unless otherwise indicated, all references in Narrative are as of the date presented and the Company does not undertake any obligation to update these numbers, or to revise or update any statement being made related thereto. Second Quarter Update During second quarter of Fiscal 2024, JCPenney remained focused on serving America’s hard-working families with a heightened sense of urgency given the overall economic difficulties they face in today’s environment. Recognizing the many choices customers must make, the Company continues to provide affordable fashion and merchandise that allows customers to make fashionable choices without sacrificing quality. Traffic overall remained soft during the period, but the overall trend for store trips improved when compared to fiscal 2023. The relaunch of the JCPenney Rewards program, initiated at the end of the first quarter, continued to resonate as the Company added over 830K new rewards members and over 30K new credit customers during the period. Store Net Promoter Scores improved over four points when compared to the same period last year. A key component in serving our customer is providing strong private label options such as St. John’s Bay, Modern Bride and Thereabouts, all of which outperformed expectations during the quarter, as well as Liz Claiborne which once again outpaced last year’s results. National Brands continue to be an important part of the mix with partners like Izod, Van Heusen and Adidas exceeding expectations for the period, while partners Levi’s and Gloria Vanderbilt drove increases in women’s denim. JCP Beauty continues to expand its offering with more prestige brands being offered with expanded lines from NYX Duck Plump, Too Faced, bareMinerals, Macadamia Professional and many others. Fragrance continued to be a strong performer (up over 30%) to last year with new fragrance offerings including Carolina Herrera and Paco Rabanne as well as exclusive lines from David Beckham and Nicki Minaj. Overall, the Company’s gross profit rates improved 70 bp to 39.4% when compared to last year. Improvements in gross profit are primarily due to a change in channel mix as well as additional savings in freight and eComm related expenses. Improving inventory efficiency remained a key area of focus and as a result, inventory was down 2% to last year. Selling, general, and administrative costs increased slightly when compared to last year primarily due to a timing shift into the quarter of marketing spend versus last year that were largely offset by savings achieved in other areas of the business. Credit income declined over last year, as a direct result of lower participation income and lower gain share from the profitability of the underlying portfolio. During the quarter, the Company generated cash of $47M which included improvements in working capital offset by seasonal purchases of inventory and capital expenditures of $59M for projects aimed at driving long-term growth of the business. The Company reported EBITDA of $29M reflecting margin improvements and ongoing cost saving efforts offset by the impact of the sales declines. The Company continues to prioritize maintaining a very healthy balance sheet with significant liquidity of approximately $1.7B as of the end of the period. The Company has less than $500M of outstanding long-term debt and as of the end of the period had no outstanding borrowings on its line of credit.
PENNEY INTERMEDIATE HOLDINGS LLC Consolidated Financial Statements (Unaudited) August 3, 2024 and July 29, 2023 Table of Contents Page Consolidated Statements of Comprehensive Income 3 Consolidated Balance Sheets 5 Consolidated Statements of Member’s Equity 6 Consolidated Statements of Cash Flows 7 Notes to the Consolidated Financial Statements 8 2
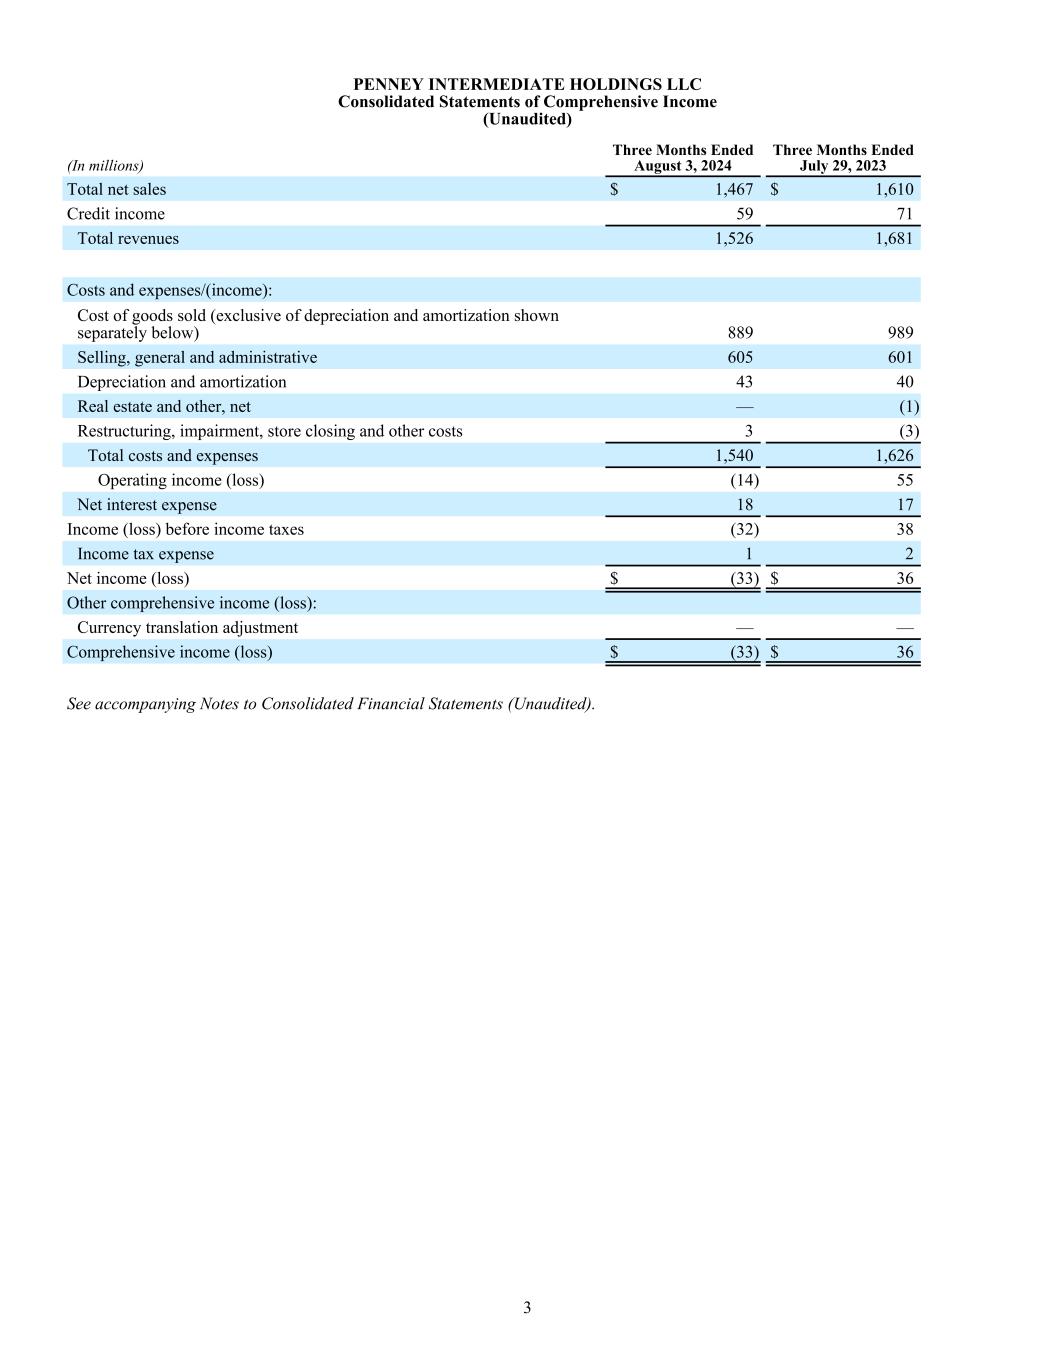
PENNEY INTERMEDIATE HOLDINGS LLC Consolidated Statements of Comprehensive Income (Unaudited) (In millions) Three Months Ended August 3, 2024 Three Months Ended July 29, 2023 Total net sales $ 1,467 $ 1,610 Credit income 59 71 Total revenues 1,526 1,681 Costs and expenses/(income): Cost of goods sold (exclusive of depreciation and amortization shown separately below) 889 989 Selling, general and administrative 605 601 Depreciation and amortization 43 40 Real estate and other, net — (1) Restructuring, impairment, store closing and other costs 3 (3) Total costs and expenses 1,540 1,626 Operating income (loss) (14) 55 Net interest expense 18 17 Income (loss) before income taxes (32) 38 Income tax expense 1 2 Net income (loss) $ (33) $ 36 Other comprehensive income (loss): Currency translation adjustment — — Comprehensive income (loss) $ (33) $ 36 See accompanying Notes to Consolidated Financial Statements (Unaudited). 3
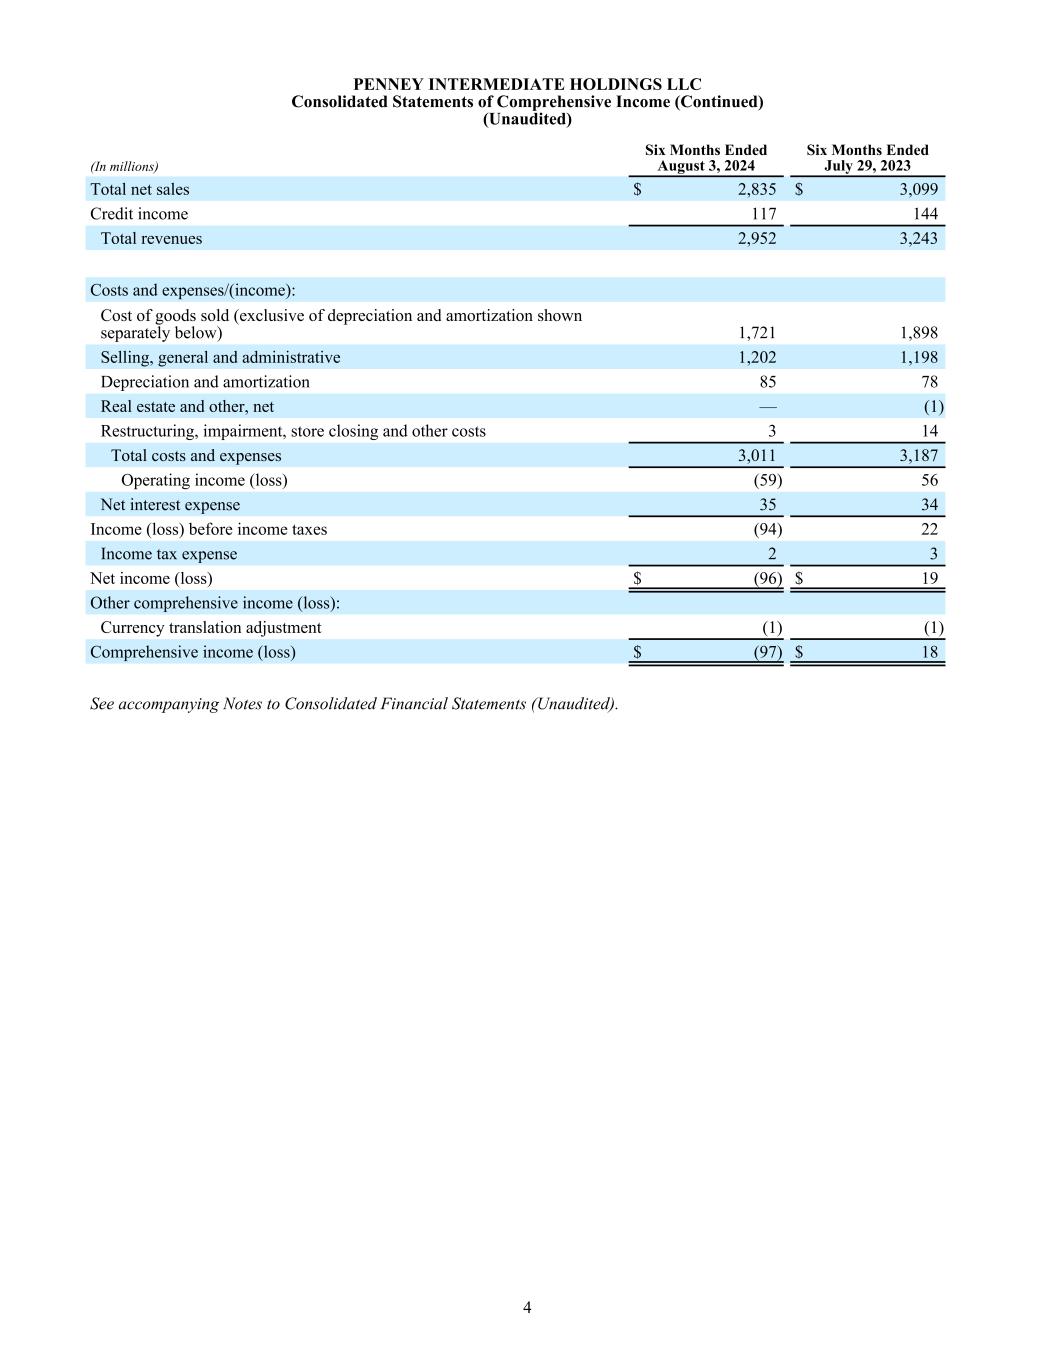
PENNEY INTERMEDIATE HOLDINGS LLC Consolidated Statements of Comprehensive Income (Continued) (Unaudited) (In millions) Six Months Ended August 3, 2024 Six Months Ended July 29, 2023 Total net sales $ 2,835 $ 3,099 Credit income 117 144 Total revenues 2,952 3,243 Costs and expenses/(income): Cost of goods sold (exclusive of depreciation and amortization shown separately below) 1,721 1,898 Selling, general and administrative 1,202 1,198 Depreciation and amortization 85 78 Real estate and other, net — (1) Restructuring, impairment, store closing and other costs 3 14 Total costs and expenses 3,011 3,187 Operating income (loss) (59) 56 Net interest expense 35 34 Income (loss) before income taxes (94) 22 Income tax expense 2 3 Net income (loss) $ (96) $ 19 Other comprehensive income (loss): Currency translation adjustment (1) (1) Comprehensive income (loss) $ (97) $ 18 See accompanying Notes to Consolidated Financial Statements (Unaudited). 4
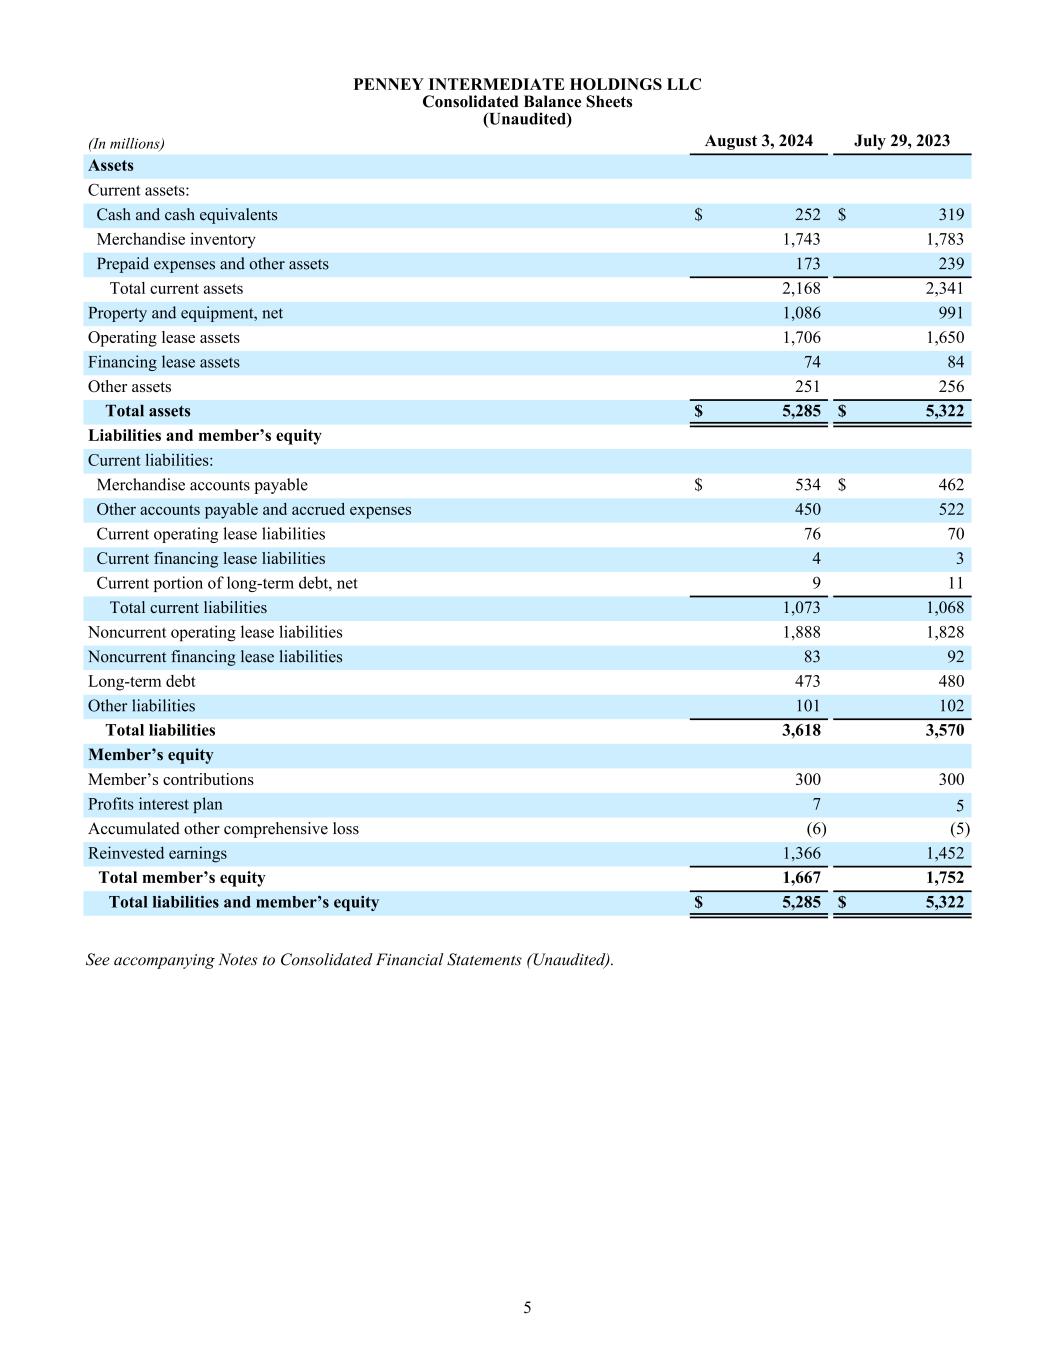
PENNEY INTERMEDIATE HOLDINGS LLC Consolidated Balance Sheets (Unaudited) (In millions) August 3, 2024 July 29, 2023 Assets Current assets: Cash and cash equivalents $ 252 $ 319 Merchandise inventory 1,743 1,783 Prepaid expenses and other assets 173 239 Total current assets 2,168 2,341 Property and equipment, net 1,086 991 Operating lease assets 1,706 1,650 Financing lease assets 74 84 Other assets 251 256 Total assets $ 5,285 $ 5,322 Liabilities and member’s equity Current liabilities: Merchandise accounts payable $ 534 $ 462 Other accounts payable and accrued expenses 450 522 Current operating lease liabilities 76 70 Current financing lease liabilities 4 3 Current portion of long-term debt, net 9 11 Total current liabilities 1,073 1,068 Noncurrent operating lease liabilities 1,888 1,828 Noncurrent financing lease liabilities 83 92 Long-term debt 473 480 Other liabilities 101 102 Total liabilities 3,618 3,570 Member’s equity Member’s contributions 300 300 Profits interest plan 7 5 Accumulated other comprehensive loss (6) (5) Reinvested earnings 1,366 1,452 Total member’s equity 1,667 1,752 Total liabilities and member’s equity $ 5,285 $ 5,322 See accompanying Notes to Consolidated Financial Statements (Unaudited). 5
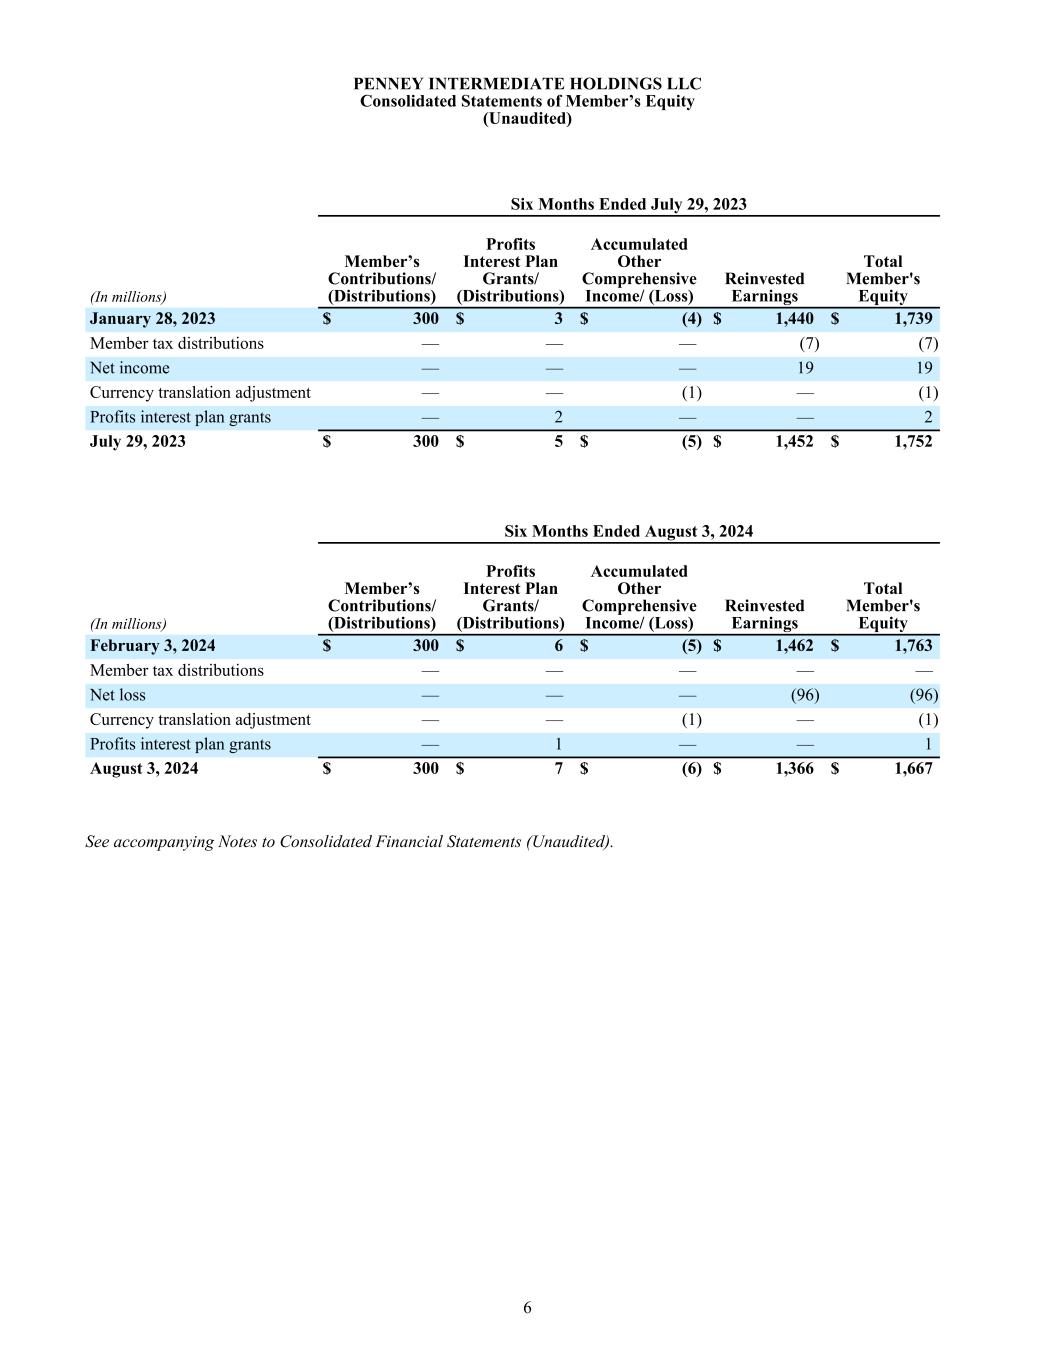
PENNEY INTERMEDIATE HOLDINGS LLC Consolidated Statements of Member’s Equity (Unaudited) Six Months Ended July 29, 2023 (In millions) Member’s Contributions/ (Distributions) Profits Interest Plan Grants/ (Distributions) Accumulated Other Comprehensive Income/ (Loss) Reinvested Earnings Total Member's Equity January 28, 2023 $ 300 $ 3 $ (4) $ 1,440 $ 1,739 Member tax distributions — — — (7) (7) Net income — — — 19 19 Currency translation adjustment — — (1) — (1) Profits interest plan grants — 2 — — 2 July 29, 2023 $ 300 $ 5 $ (5) $ 1,452 $ 1,752 Six Months Ended August 3, 2024 (In millions) Member’s Contributions/ (Distributions) Profits Interest Plan Grants/ (Distributions) Accumulated Other Comprehensive Income/ (Loss) Reinvested Earnings Total Member's Equity February 3, 2024 $ 300 $ 6 $ (5) $ 1,462 $ 1,763 Member tax distributions — — — — — Net loss — — — (96) (96) Currency translation adjustment — — (1) — (1) Profits interest plan grants — 1 — — 1 August 3, 2024 $ 300 $ 7 $ (6) $ 1,366 $ 1,667 See accompanying Notes to Consolidated Financial Statements (Unaudited). 6
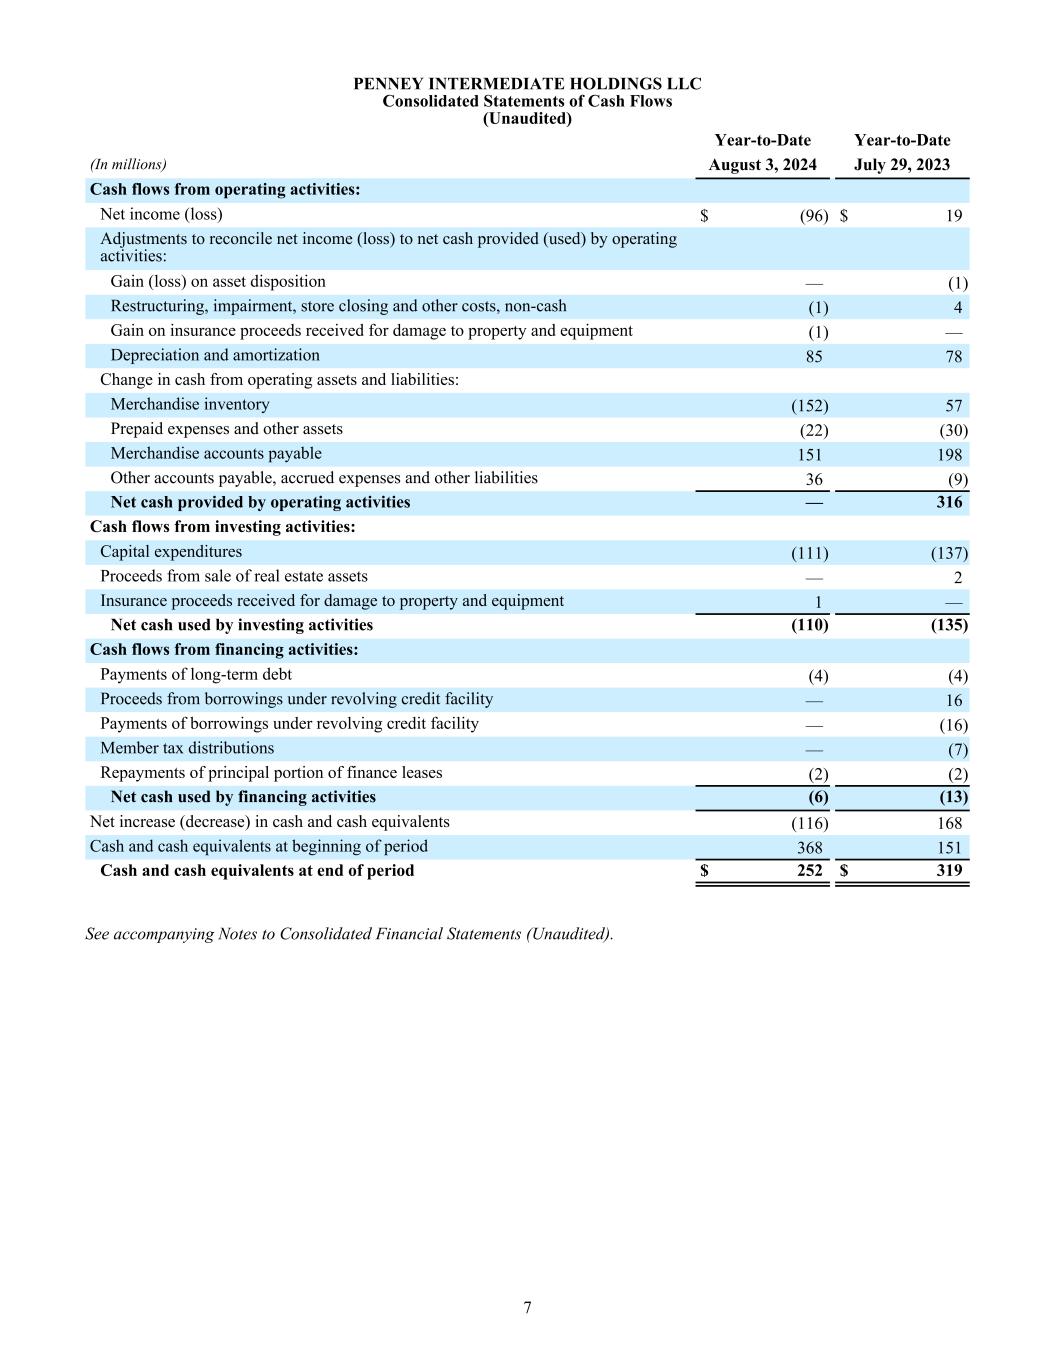
PENNEY INTERMEDIATE HOLDINGS LLC Consolidated Statements of Cash Flows (Unaudited) Year-to-Date Year-to-Date (In millions) August 3, 2024 July 29, 2023 Cash flows from operating activities: Net income (loss) $ (96) $ 19 Adjustments to reconcile net income (loss) to net cash provided (used) by operating activities: Gain (loss) on asset disposition — (1) Restructuring, impairment, store closing and other costs, non-cash (1) 4 Gain on insurance proceeds received for damage to property and equipment (1) — Depreciation and amortization 85 78 Change in cash from operating assets and liabilities: Merchandise inventory (152) 57 Prepaid expenses and other assets (22) (30) Merchandise accounts payable 151 198 Other accounts payable, accrued expenses and other liabilities 36 (9) Net cash provided by operating activities — 316 Cash flows from investing activities: Capital expenditures (111) (137) Proceeds from sale of real estate assets — 2 Insurance proceeds received for damage to property and equipment 1 — Net cash used by investing activities (110) (135) Cash flows from financing activities: Payments of long-term debt (4) (4) Proceeds from borrowings under revolving credit facility — 16 Payments of borrowings under revolving credit facility — (16) Member tax distributions — (7) Repayments of principal portion of finance leases (2) (2) Net cash used by financing activities (6) (13) Net increase (decrease) in cash and cash equivalents (116) 168 Cash and cash equivalents at beginning of period 368 151 Cash and cash equivalents at end of period $ 252 $ 319 See accompanying Notes to Consolidated Financial Statements (Unaudited). 7
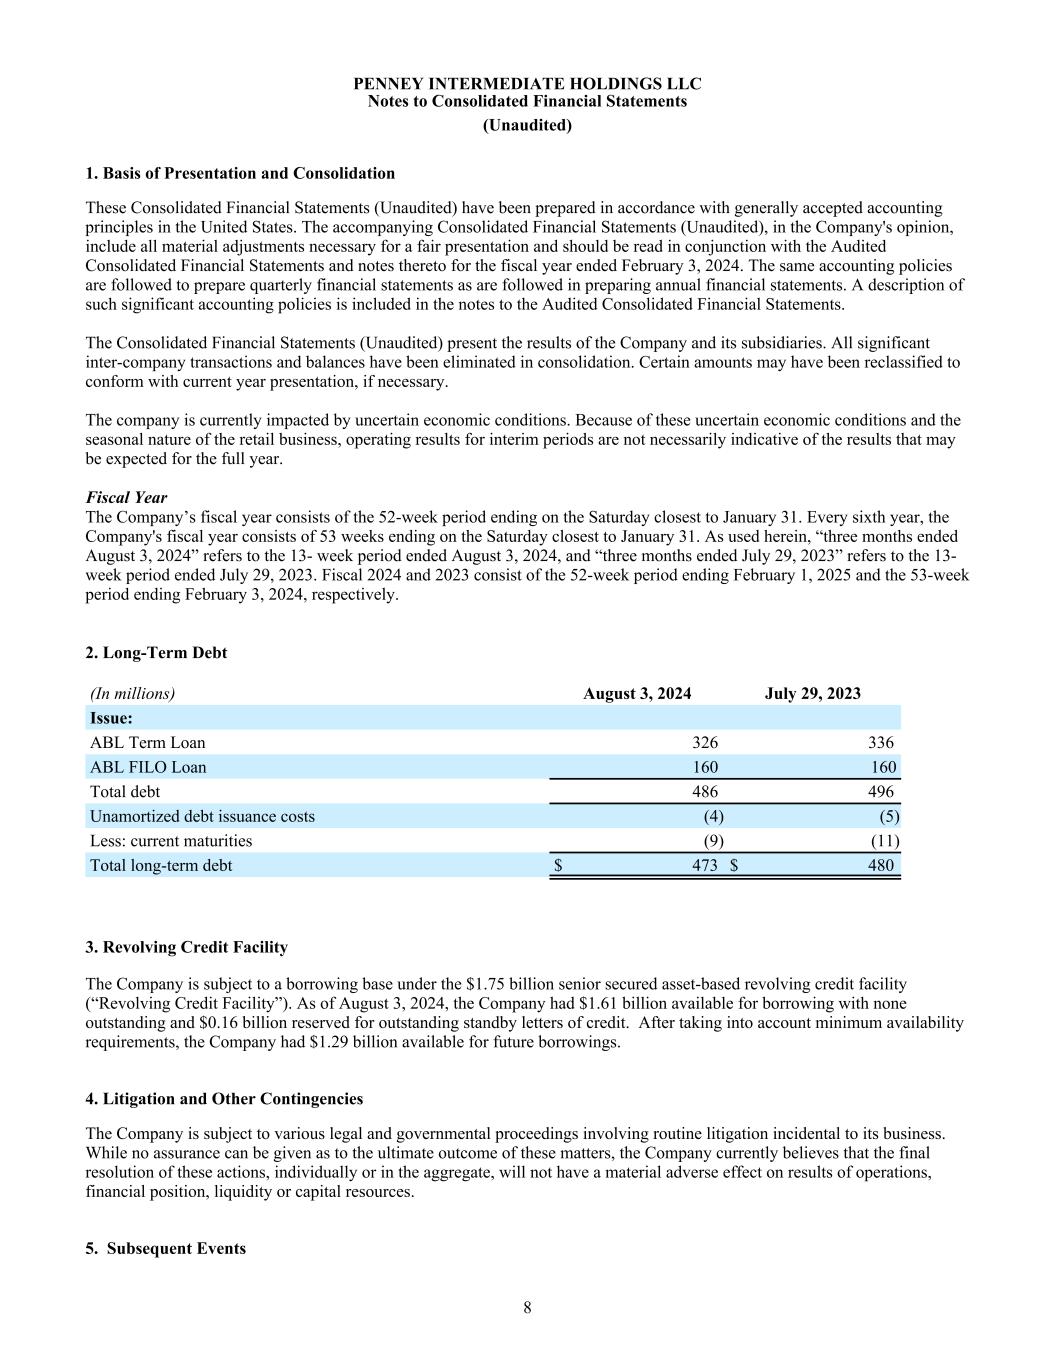
PENNEY INTERMEDIATE HOLDINGS LLC Notes to Consolidated Financial Statements (Unaudited) 1. Basis of Presentation and Consolidation These Consolidated Financial Statements (Unaudited) have been prepared in accordance with generally accepted accounting principles in the United States. The accompanying Consolidated Financial Statements (Unaudited), in the Company's opinion, include all material adjustments necessary for a fair presentation and should be read in conjunction with the Audited Consolidated Financial Statements and notes thereto for the fiscal year ended February 3, 2024. The same accounting policies are followed to prepare quarterly financial statements as are followed in preparing annual financial statements. A description of such significant accounting policies is included in the notes to the Audited Consolidated Financial Statements. The Consolidated Financial Statements (Unaudited) present the results of the Company and its subsidiaries. All significant inter-company transactions and balances have been eliminated in consolidation. Certain amounts may have been reclassified to conform with current year presentation, if necessary. The company is currently impacted by uncertain economic conditions. Because of these uncertain economic conditions and the seasonal nature of the retail business, operating results for interim periods are not necessarily indicative of the results that may be expected for the full year. Fiscal Year The Company’s fiscal year consists of the 52-week period ending on the Saturday closest to January 31. Every sixth year, the Company's fiscal year consists of 53 weeks ending on the Saturday closest to January 31. As used herein, “three months ended August 3, 2024” refers to the 13- week period ended August 3, 2024, and “three months ended July 29, 2023” refers to the 13- week period ended July 29, 2023. Fiscal 2024 and 2023 consist of the 52-week period ending February 1, 2025 and the 53-week period ending February 3, 2024, respectively. 2. Long-Term Debt (In millions) August 3, 2024 July 29, 2023 Issue: ABL Term Loan 326 336 ABL FILO Loan 160 160 Total debt 486 496 Unamortized debt issuance costs (4) (5) Less: current maturities (9) (11) Total long-term debt $ 473 $ 480 3. Revolving Credit Facility The Company is subject to a borrowing base under the $1.75 billion senior secured asset-based revolving credit facility (“Revolving Credit Facility”). As of August 3, 2024, the Company had $1.61 billion available for borrowing with none outstanding and $0.16 billion reserved for outstanding standby letters of credit. After taking into account minimum availability requirements, the Company had $1.29 billion available for future borrowings. 4. Litigation and Other Contingencies The Company is subject to various legal and governmental proceedings involving routine litigation incidental to its business. While no assurance can be given as to the ultimate outcome of these matters, the Company currently believes that the final resolution of these actions, individually or in the aggregate, will not have a material adverse effect on results of operations, financial position, liquidity or capital resources. 5. Subsequent Events 8

The Company has evaluated subsequent events from the balance sheet date through September 17, 2024, the date at which the financial statements were available to be issued. 9
STATEMENT OF CONSOLIDATED ADJUSTED EBITDA (follows this page)
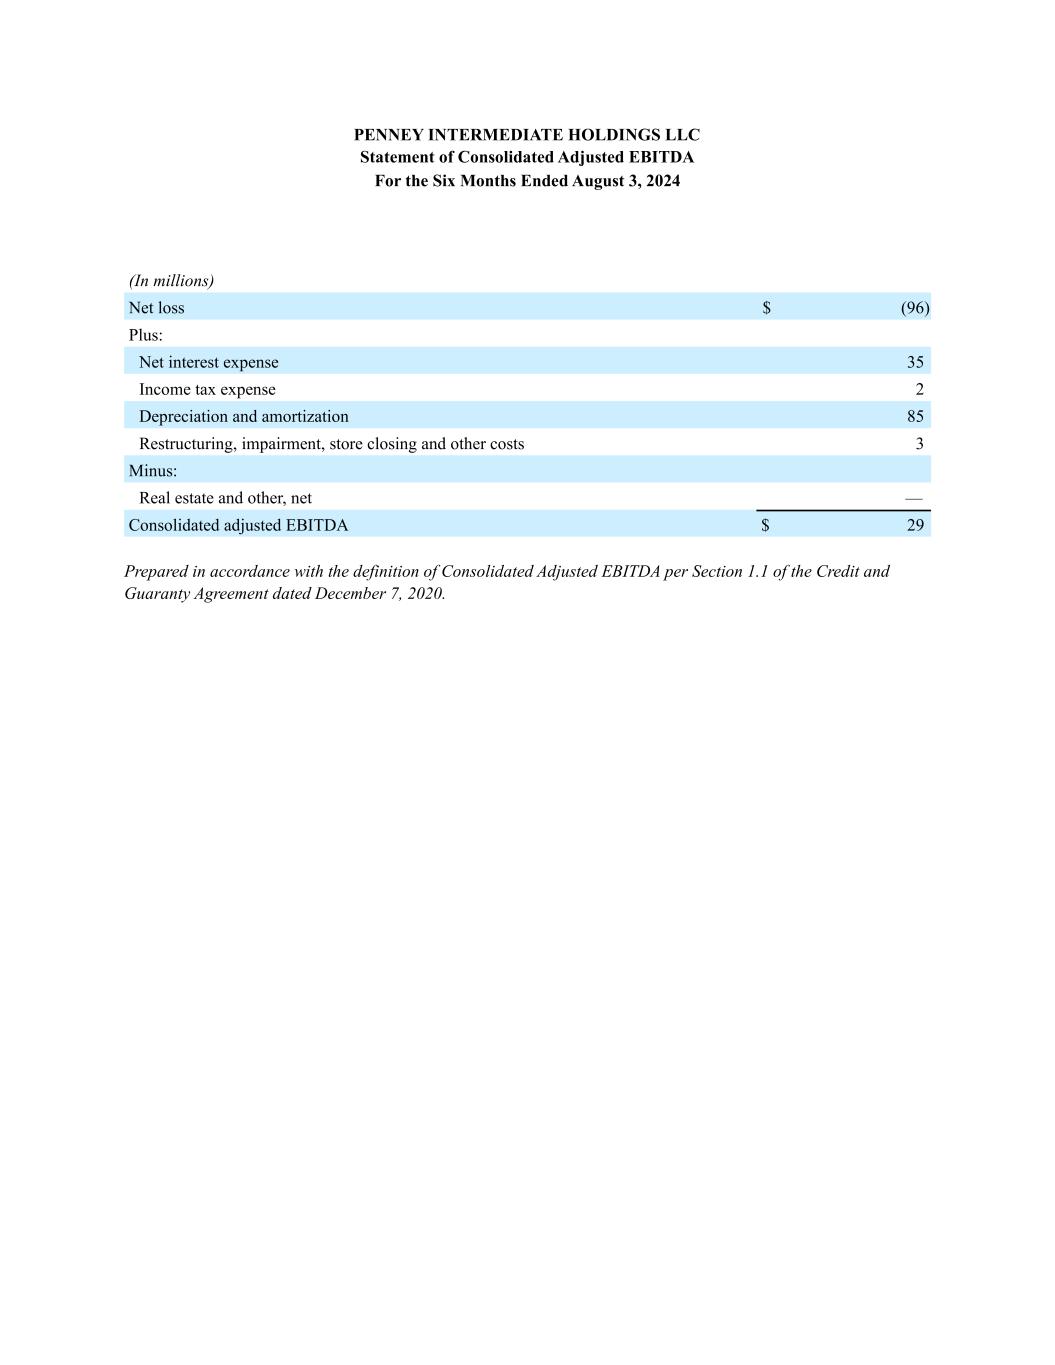
PENNEY INTERMEDIATE HOLDINGS LLC Statement of Consolidated Adjusted EBITDA For the Six Months Ended August 3, 2024 (In millions) Net loss $ (96) Plus: Net interest expense 35 Income tax expense 2 Depreciation and amortization 85 Restructuring, impairment, store closing and other costs 3 Minus: Real estate and other, net — Consolidated adjusted EBITDA $ 29 Prepared in accordance with the definition of Consolidated Adjusted EBITDA per Section 1.1 of the Credit and Guaranty Agreement dated December 7, 2020.

STORE REPORTING PACKAGE (follows this page)
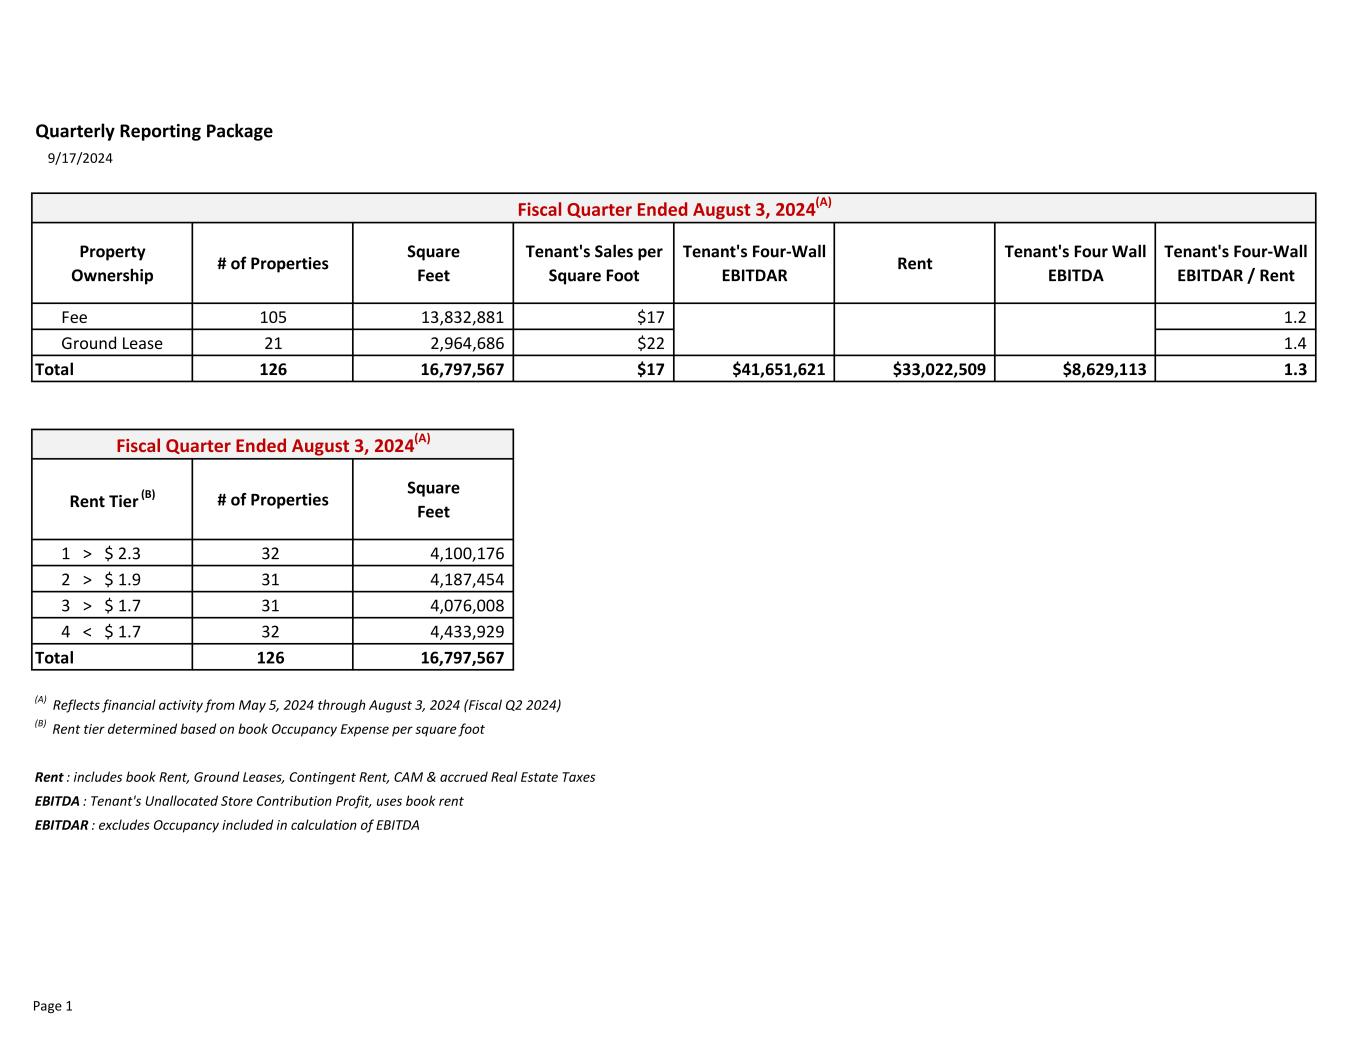
Quarterly Reporting Package 9/17/2024 Property Ownership # of Properties Square Feet Tenant's Sales per Square Foot Tenant's Four-Wall EBITDAR Rent Tenant's Four Wall EBITDA Tenant's Four-Wall EBITDAR / Rent Fee 105 13,832,881 $17 $31,775,639 $25,933,283 $5,842,356 1.2 Ground Lease 21 2,964,686 $22 $9,875,983 $7,089,226 $2,786,757 1.4 Total 126 16,797,567 $17 $41,651,621 $33,022,509 $8,629,113 1.3 Rent Tier (B) # of Properties Square Feet 1 > $ 2.3 32 4,100,176 2 > $ 1.9 31 4,187,454 3 > $ 1.7 31 4,076,008 4 < $ 1.7 32 4,433,929 Total 126 16,797,567 (A) Reflects financial activity from May 5, 2024 through August 3, 2024 (Fiscal Q2 2024) (B) Rent tier determined based on book Occupancy Expense per square foot Rent : includes book Rent, Ground Leases, Contingent Rent, CAM & accrued Real Estate Taxes EBITDA : Tenant's Unallocated Store Contribution Profit, uses book rent EBITDAR : excludes Occupancy included in calculation of EBITDA Fiscal Quarter Ended August 3, 2024(A) Fiscal Quarter Ended August 3, 2024(A) Page 1
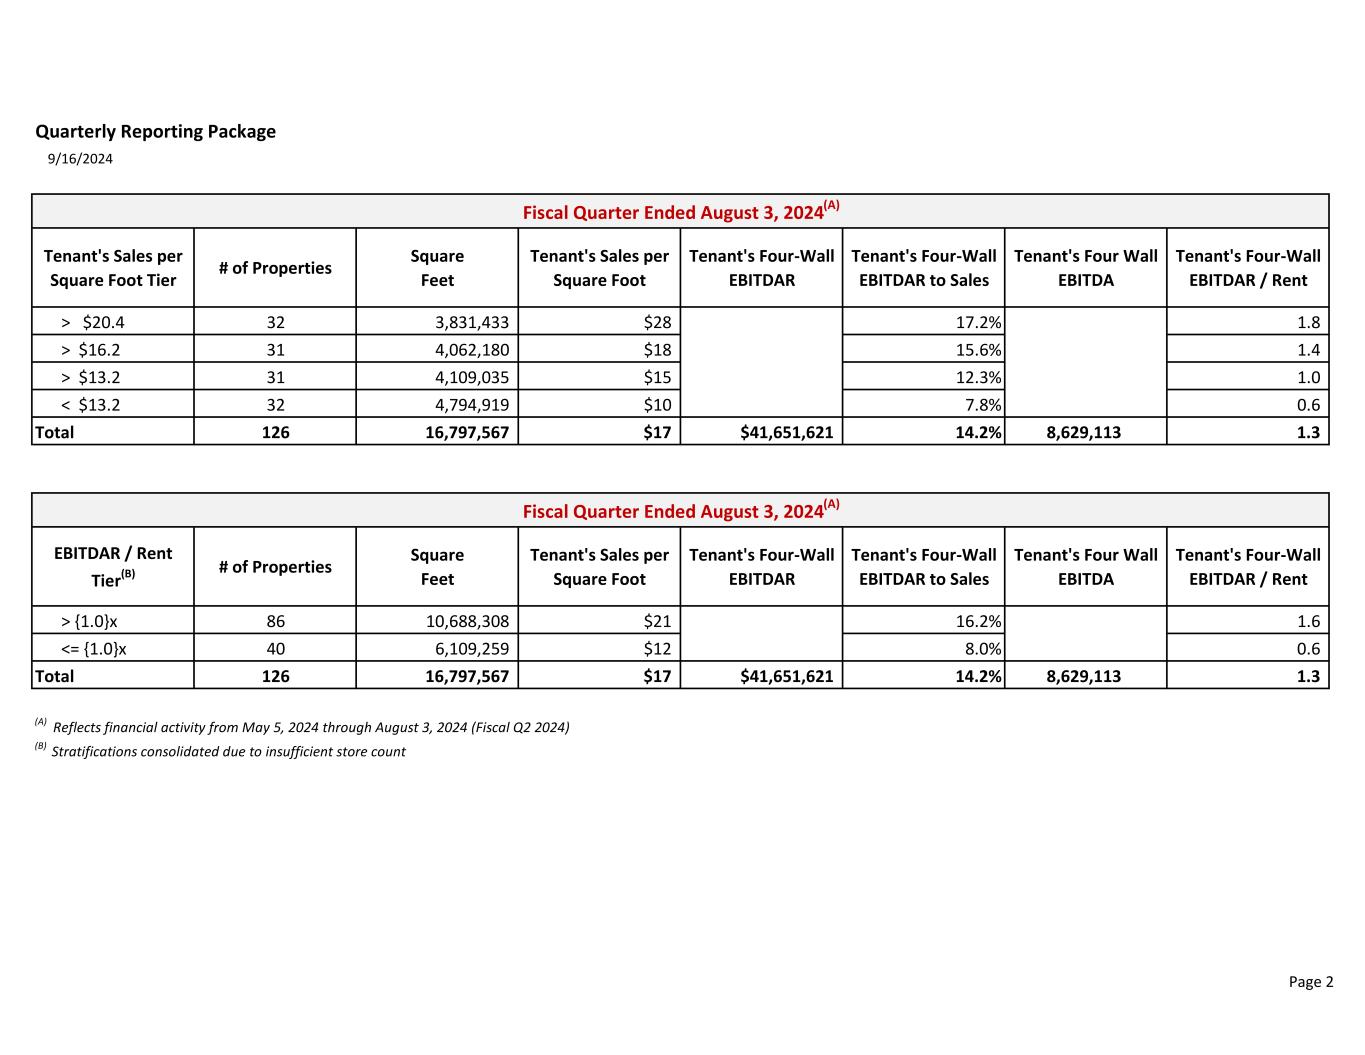
Quarterly Reporting Package 9/16/2024 Tenant's Sales per Square Foot Tier # of Properties Square Feet Tenant's Sales per Square Foot Tenant's Four-Wall EBITDAR Tenant's Four-Wall EBITDAR to Sales Tenant's Four Wall EBITDA Tenant's Four-Wall EBITDAR / Rent > $20.4 32 3,831,433 $28 17.2% 1.8 > $16.2 31 4,062,180 $18 15.6% 1.4 > $13.2 31 4,109,035 $15 12.3% 1.0 < $13.2 32 4,794,919 $10 7.8% 0.6 Total 126 16,797,567 $17 $41,651,621 14.2% 8,629,113 1.3 EBITDAR / Rent Tier(B) # of Properties Square Feet Tenant's Sales per Square Foot Tenant's Four-Wall EBITDAR Tenant's Four-Wall EBITDAR to Sales Tenant's Four Wall EBITDA Tenant's Four-Wall EBITDAR / Rent > {1.0}x 86 10,688,308 $21 16.2% 1.6 <= {1.0}x 40 6,109,259 $12 8.0% 0.6 Total 126 16,797,567 $17 $41,651,621 14.2% 8,629,113 1.3 (A) Reflects financial activity from May 5, 2024 through August 3, 2024 (Fiscal Q2 2024) (B) Stratifications consolidated due to insufficient store count Fiscal Quarter Ended August 3, 2024(A) Fiscal Quarter Ended August 3, 2024(A) Page 2
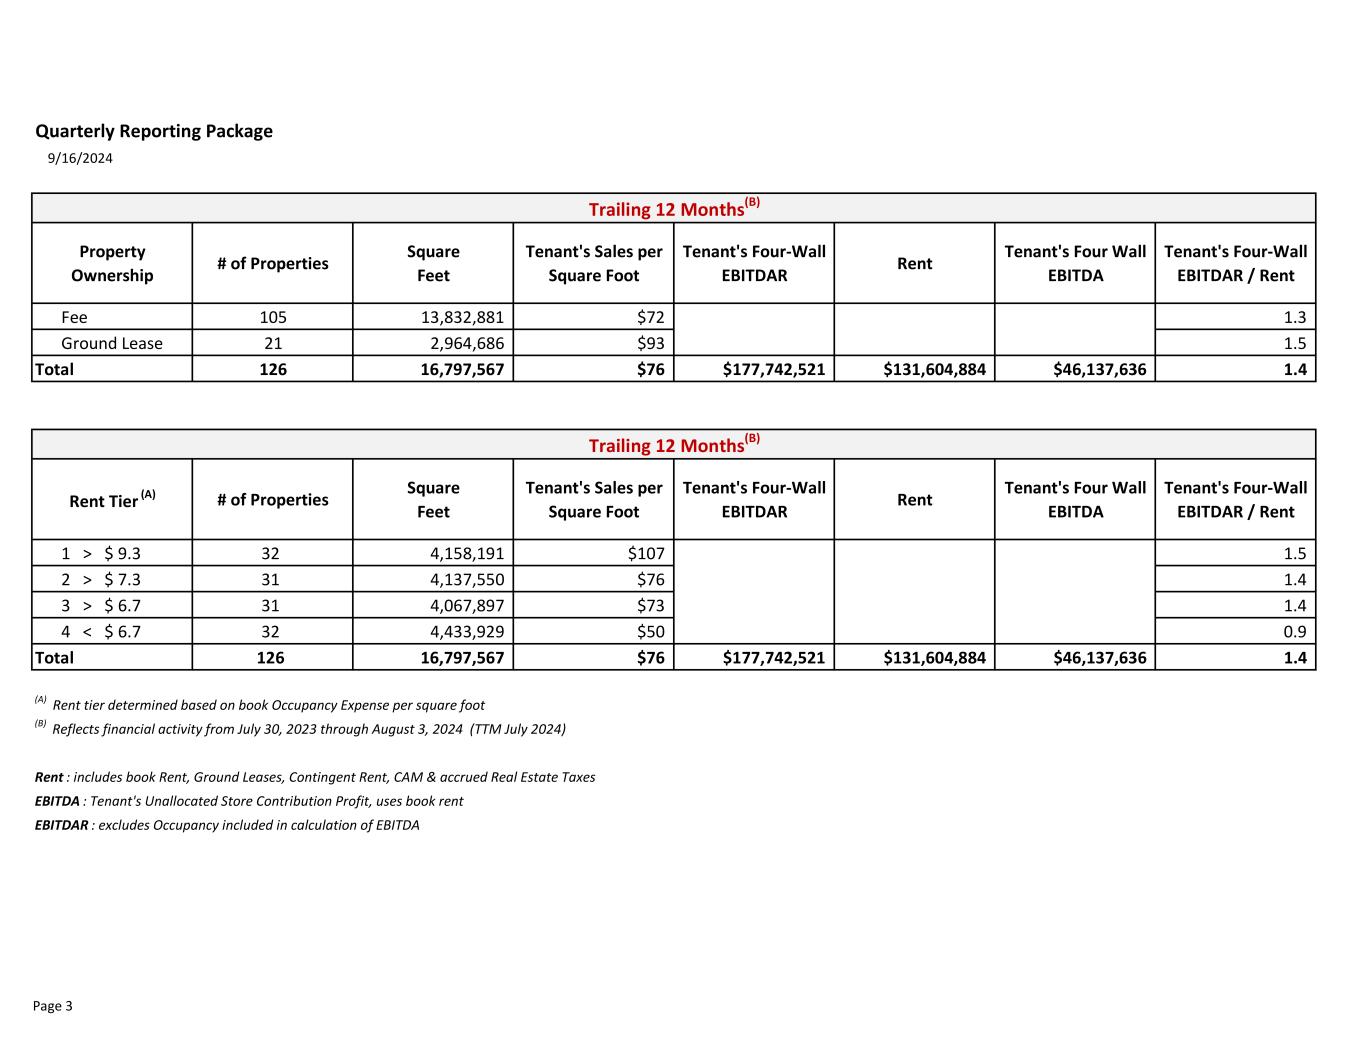
Quarterly Reporting Package 9/16/2024 Property Ownership # of Properties Square Feet Tenant's Sales per Square Foot Tenant's Four-Wall EBITDAR Rent Tenant's Four Wall EBITDA Tenant's Four-Wall EBITDAR / Rent Fee 105 13,832,881 $72 $135,766,562 $103,011,722 $32,754,840 1.3 Ground Lease 21 2,964,686 $93 $41,975,959 $28,593,163 $13,382,796 1.5 Total 126 16,797,567 $76 $177,742,521 $131,604,884 $46,137,636 1.4 Rent Tier (A) # of Properties Square Feet Tenant's Sales per Square Foot Tenant's Four-Wall EBITDAR Rent Tenant's Four Wall EBITDA Tenant's Four-Wall EBITDAR / Rent 1 > $ 9.3 32 4,158,191 $107 $71,410,764 $47,413,093 1.5 2 > $ 7.3 31 4,137,550 $76 $45,950,463 $33,893,584 1.4 3 > $ 6.7 31 4,067,897 $73 $41,150,578 $28,559,255 1.4 4 < $ 6.7 32 4,433,929 $50 $19,230,715 $21,738,952 0.9 Total 126 16,797,567 $76 $177,742,521 $131,604,884 $46,137,636 1.4 (A) Rent tier determined based on book Occupancy Expense per square foot (B) Reflects financial activity from July 30, 2023 through August 3, 2024 (TTM July 2024) Rent : includes book Rent, Ground Leases, Contingent Rent, CAM & accrued Real Estate Taxes EBITDA : Tenant's Unallocated Store Contribution Profit, uses book rent EBITDAR : excludes Occupancy included in calculation of EBITDA Trailing 12 Months(B) Trailing 12 Months(B) Page 3
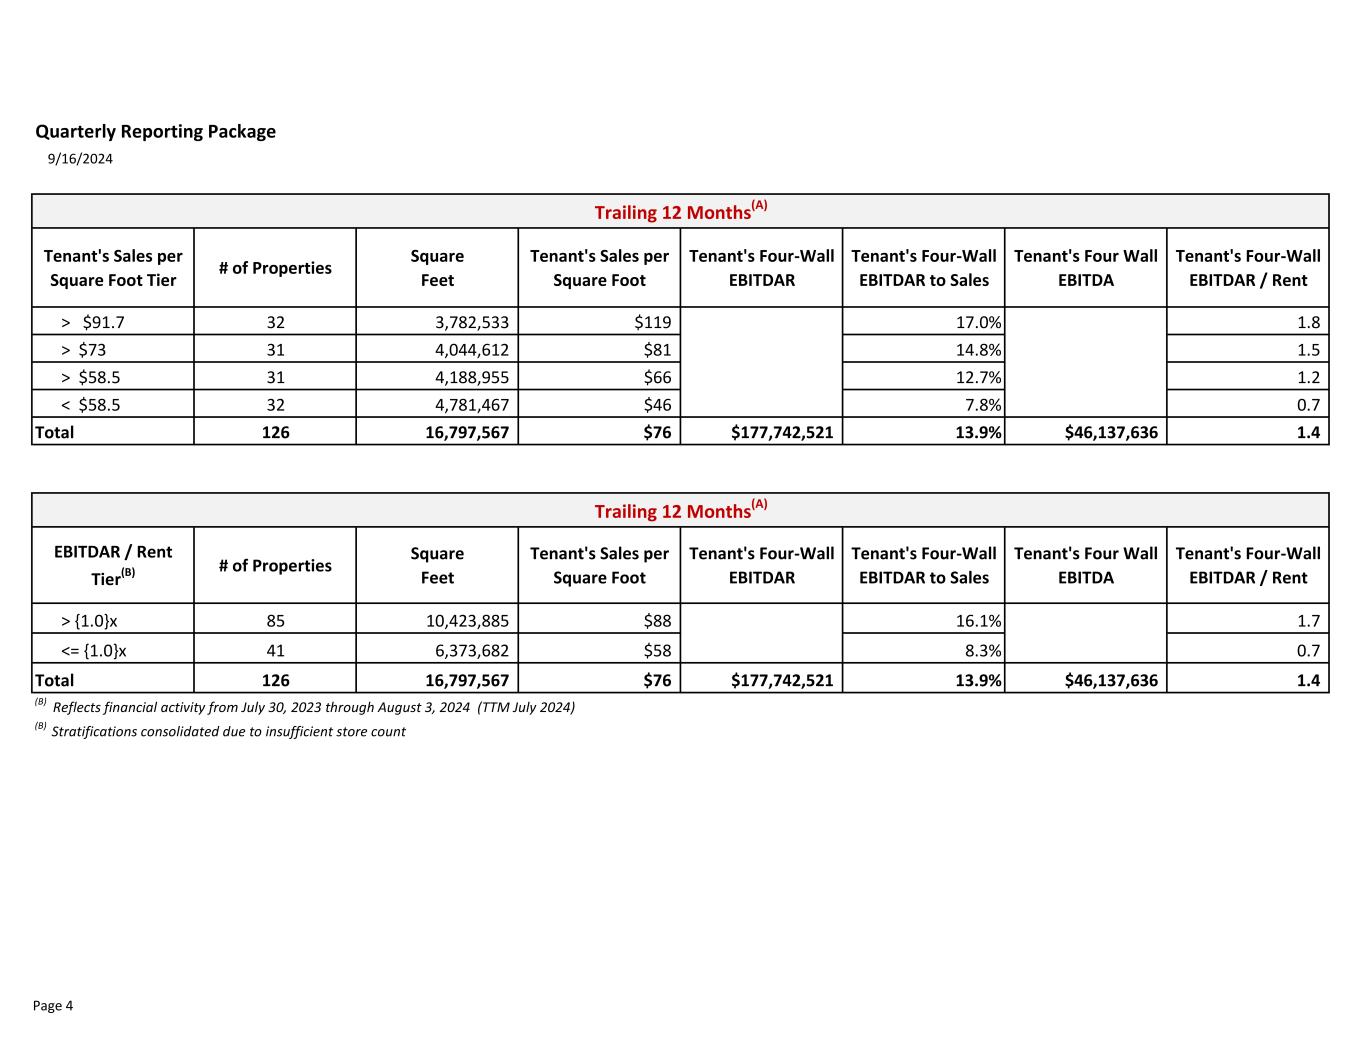
Quarterly Reporting Package 9/16/2024 Tenant's Sales per Square Foot Tier # of Properties Square Feet Tenant's Sales per Square Foot Tenant's Four-Wall EBITDAR Tenant's Four-Wall EBITDAR to Sales Tenant's Four Wall EBITDA Tenant's Four-Wall EBITDAR / Rent > $91.7 32 3,782,533 $119 17.0% 1.8 > $73 31 4,044,612 $81 14.8% 1.5 > $58.5 31 4,188,955 $66 12.7% 1.2 < $58.5 32 4,781,467 $46 7.8% 0.7 Total 126 16,797,567 $76 $177,742,521 13.9% $46,137,636 1.4 EBITDAR / Rent Tier(B) # of Properties Square Feet Tenant's Sales per Square Foot Tenant's Four-Wall EBITDAR Tenant's Four-Wall EBITDAR to Sales Tenant's Four Wall EBITDA Tenant's Four-Wall EBITDAR / Rent > {1.0}x 85 10,423,885 $88 16.1% 1.7 <= {1.0}x 41 6,373,682 $58 8.3% 0.7 Total 126 16,797,567 $76 $177,742,521 13.9% $46,137,636 1.4 (B) Reflects financial activity from July 30, 2023 through August 3, 2024 (TTM July 2024) (B) Stratifications consolidated due to insufficient store count Trailing 12 Months(A) Trailing 12 Months(A) Page 4
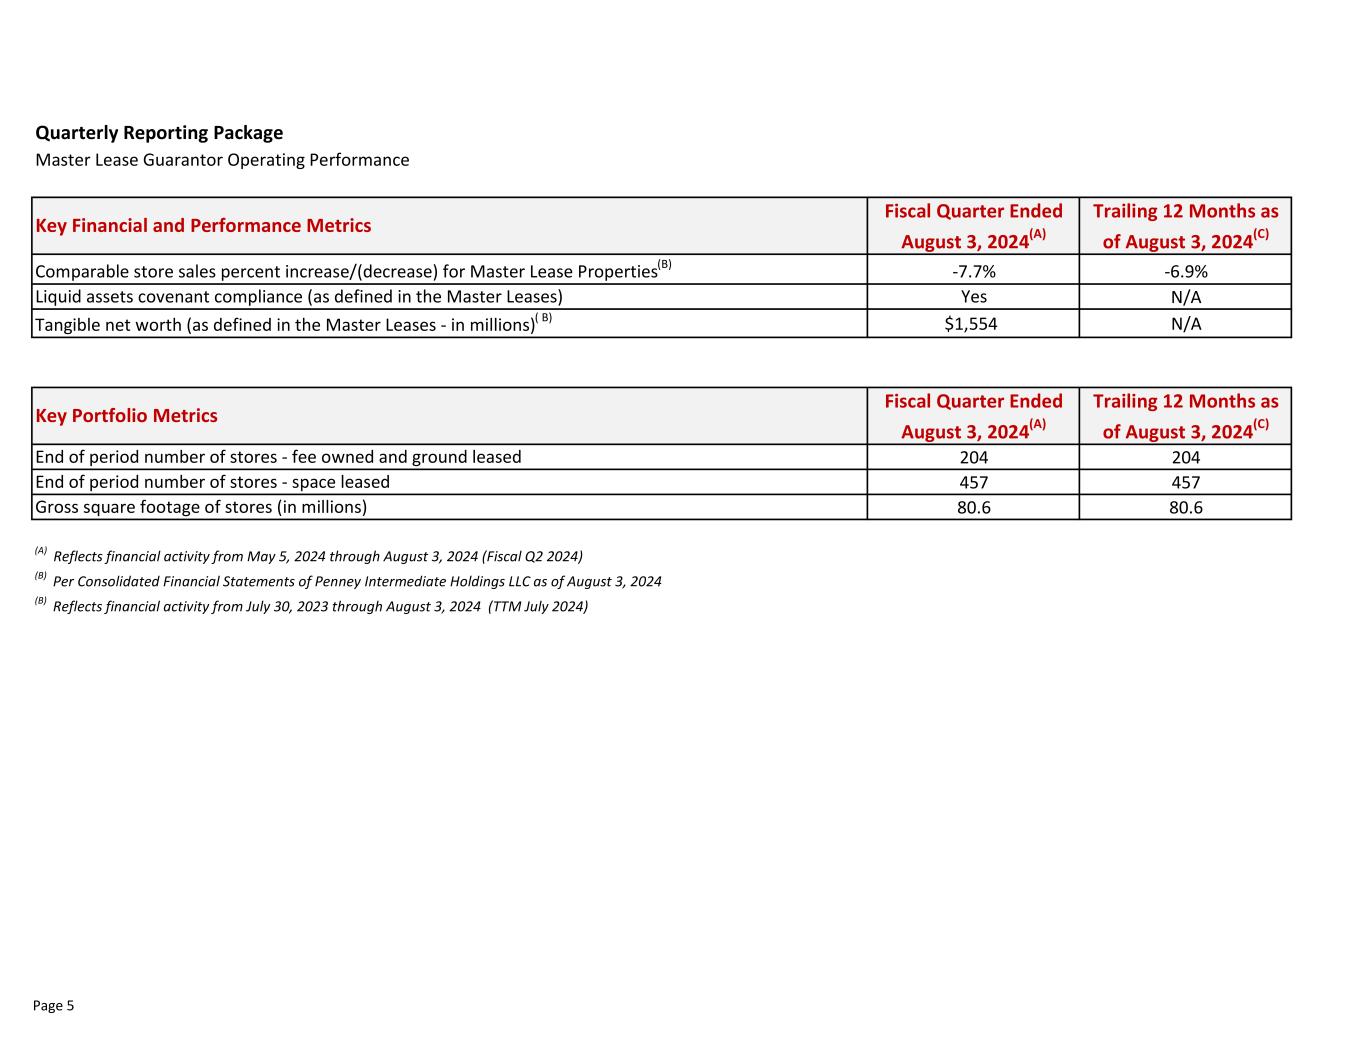
Quarterly Reporting Package Master Lease Guarantor Operating Performance Fiscal Quarter Ended August 3, 2024(A) Trailing 12 Months as of August 3, 2024(C) -7.7% -6.9% Yes N/A $1,554 N/A Fiscal Quarter Ended August 3, 2024(A) Trailing 12 Months as of August 3, 2024(C) 204 204 457 457 80.6 80.6 (A) Reflects financial activity from May 5, 2024 through August 3, 2024 (Fiscal Q2 2024) (B) Per Consolidated Financial Statements of Penney Intermediate Holdings LLC as of August 3, 2024 (B) Reflects financial activity from July 30, 2023 through August 3, 2024 (TTM July 2024) End of period number of stores - space leased Gross square footage of stores (in millions) Key Financial and Performance Metrics Comparable store sales percent increase/(decrease) for Master Lease Properties(B) Liquid assets covenant compliance (as defined in the Master Leases) Tangible net worth (as defined in the Master Leases - in millions)( B) Key Portfolio Metrics End of period number of stores - fee owned and ground leased Page 5