
STORE REPORTING PACKAGE (follows this page)
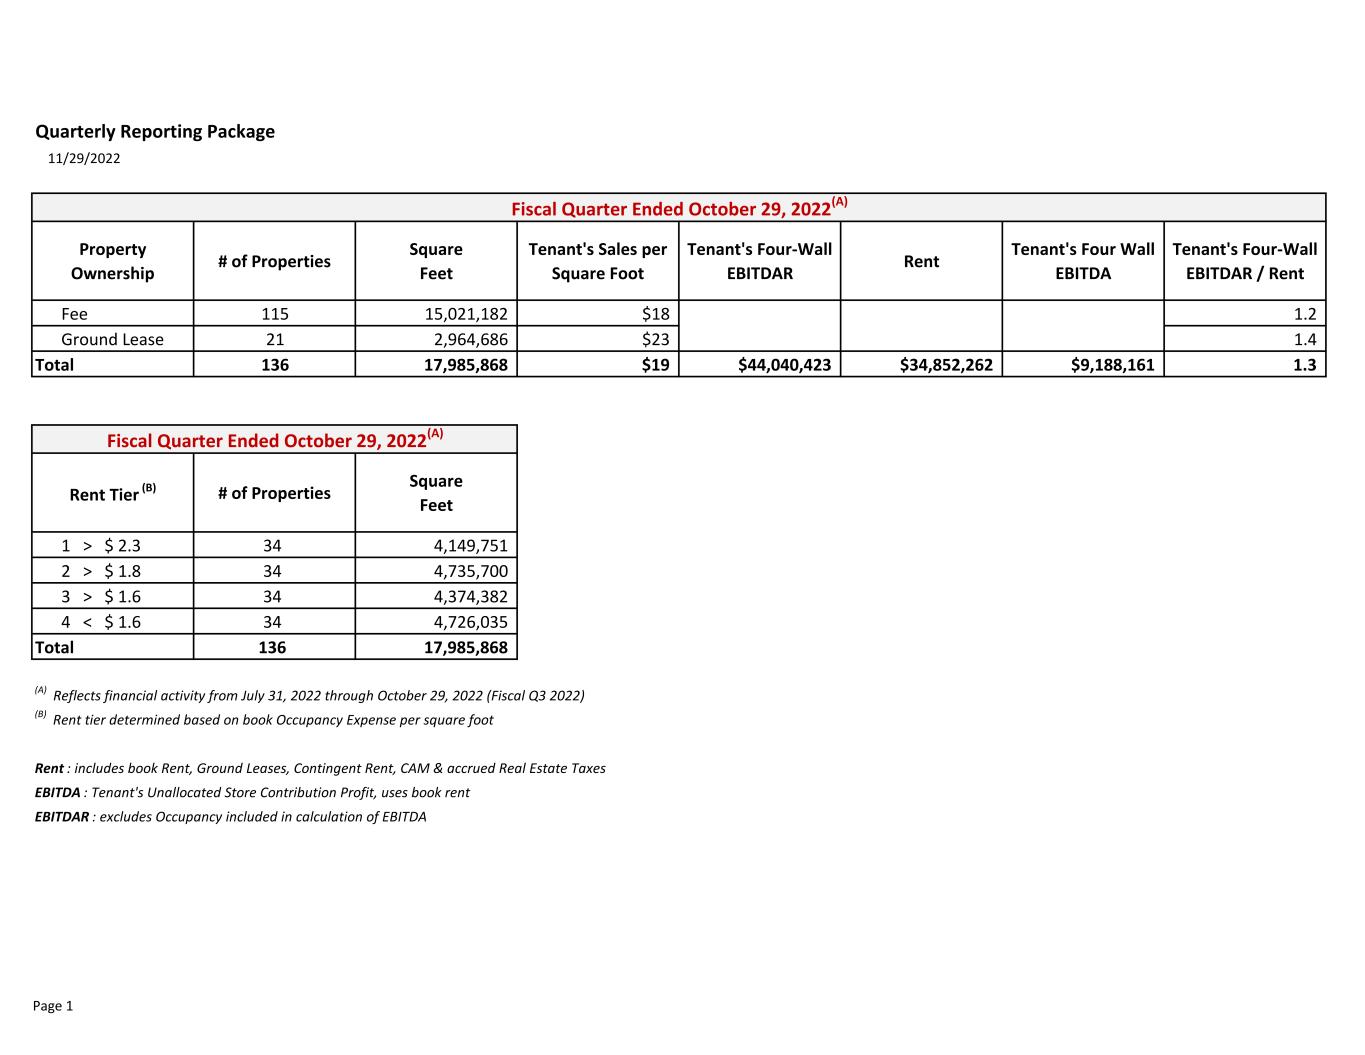
Quarterly Reporting Package 11/29/2022 Property Ownership # of Properties Square Feet Tenant's Sales per Square Foot Tenant's Four-Wall EBITDAR Rent Tenant's Four Wall EBITDA Tenant's Four-Wall EBITDAR / Rent Fee 115 15,021,182 $18 $34,125,759 $27,757,338 $6,368,421 1.2 Ground Lease 21 2,964,686 $23 $9,914,664 $7,094,924 $2,819,740 1.4 Total 136 17,985,868 $19 $44,040,423 $34,852,262 $9,188,161 1.3 Rent Tier (B) # of Properties Square Feet 1 > $ 2.3 34 4,149,751 2 > $ 1.8 34 4,735,700 3 > $ 1.6 34 4,374,382 4 < $ 1.6 34 4,726,035 Total 136 17,985,868 (A) Reflects financial activity from July 31, 2022 through October 29, 2022 (Fiscal Q3 2022) (B) Rent tier determined based on book Occupancy Expense per square foot Rent : includes book Rent, Ground Leases, Contingent Rent, CAM & accrued Real Estate Taxes EBITDA : Tenant's Unallocated Store Contribution Profit, uses book rent EBITDAR : excludes Occupancy included in calculation of EBITDA Fiscal Quarter Ended October 29, 2022(A) Fiscal Quarter Ended October 29, 2022(A) Page 1
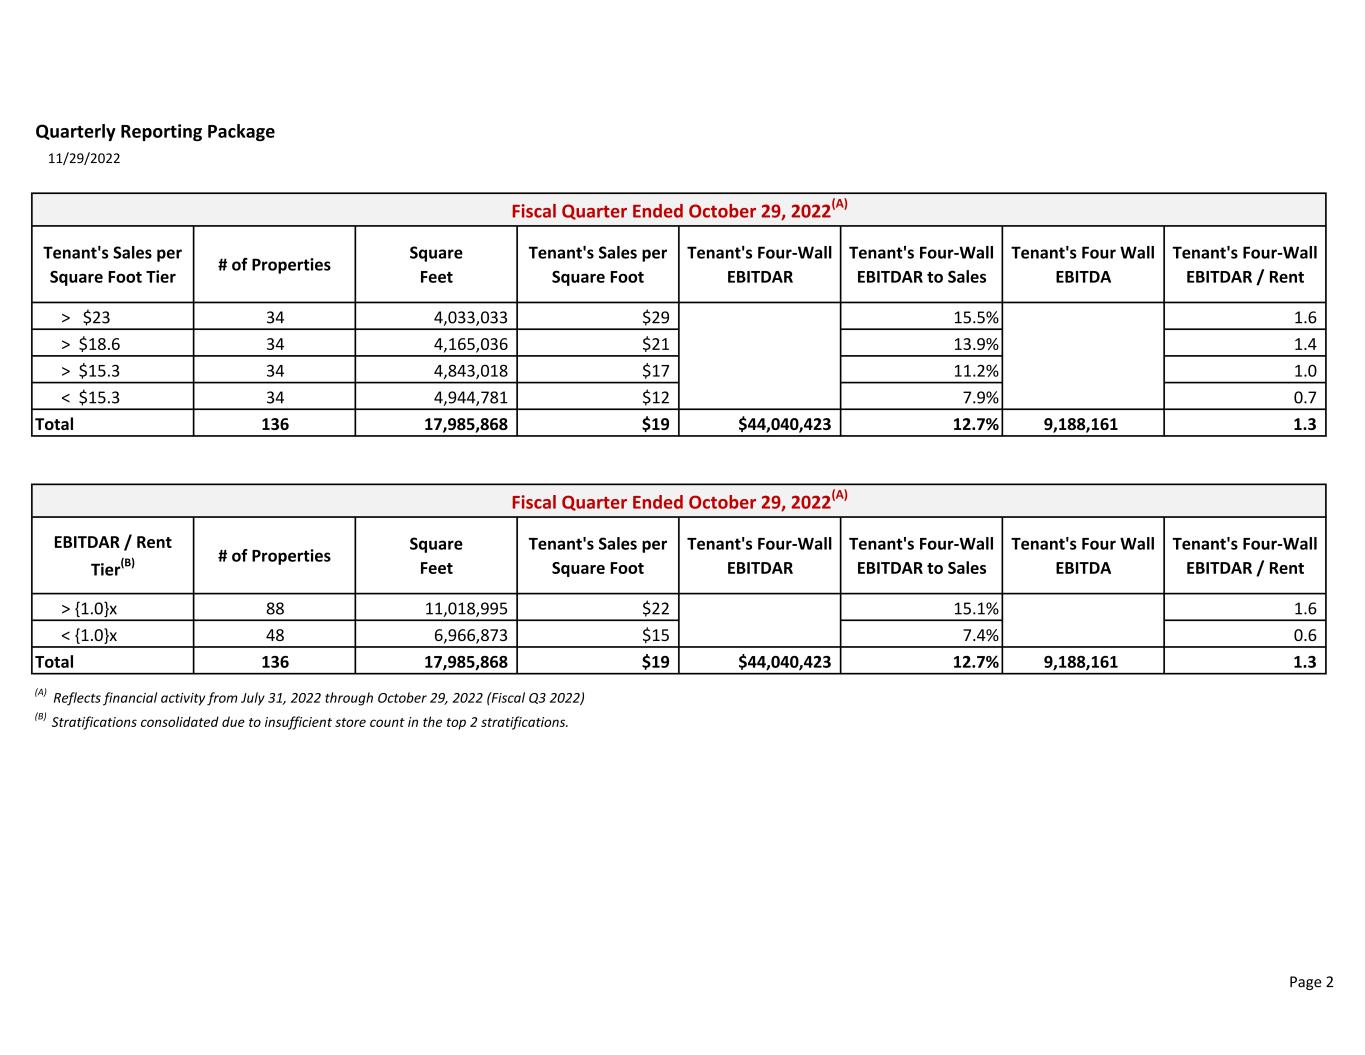
Quarterly Reporting Package 11/29/2022 Tenant's Sales per Square Foot Tier # of Properties Square Feet Tenant's Sales per Square Foot Tenant's Four-Wall EBITDAR Tenant's Four-Wall EBITDAR to Sales Tenant's Four Wall EBITDA Tenant's Four-Wall EBITDAR / Rent > $23 34 4,033,033 $29 15.5% 1.6 > $18.6 34 4,165,036 $21 13.9% 1.4 > $15.3 34 4,843,018 $17 11.2% 1.0 < $15.3 34 4,944,781 $12 7.9% 0.7 Total 136 17,985,868 $19 $44,040,423 12.7% 9,188,161 1.3 EBITDAR / Rent Tier(B) # of Properties Square Feet Tenant's Sales per Square Foot Tenant's Four-Wall EBITDAR Tenant's Four-Wall EBITDAR to Sales Tenant's Four Wall EBITDA Tenant's Four-Wall EBITDAR / Rent > {1.0}x 88 11,018,995 $22 15.1% 1.6 < {1.0}x 48 6,966,873 $15 7.4% 0.6 Total 136 17,985,868 $19 $44,040,423 12.7% 9,188,161 1.3 (A) Reflects financial activity from July 31, 2022 through October 29, 2022 (Fiscal Q3 2022) (B) Stratifications consolidated due to insufficient store count in the top 2 stratifications. Fiscal Quarter Ended October 29, 2022(A) Fiscal Quarter Ended October 29, 2022(A) Page 2
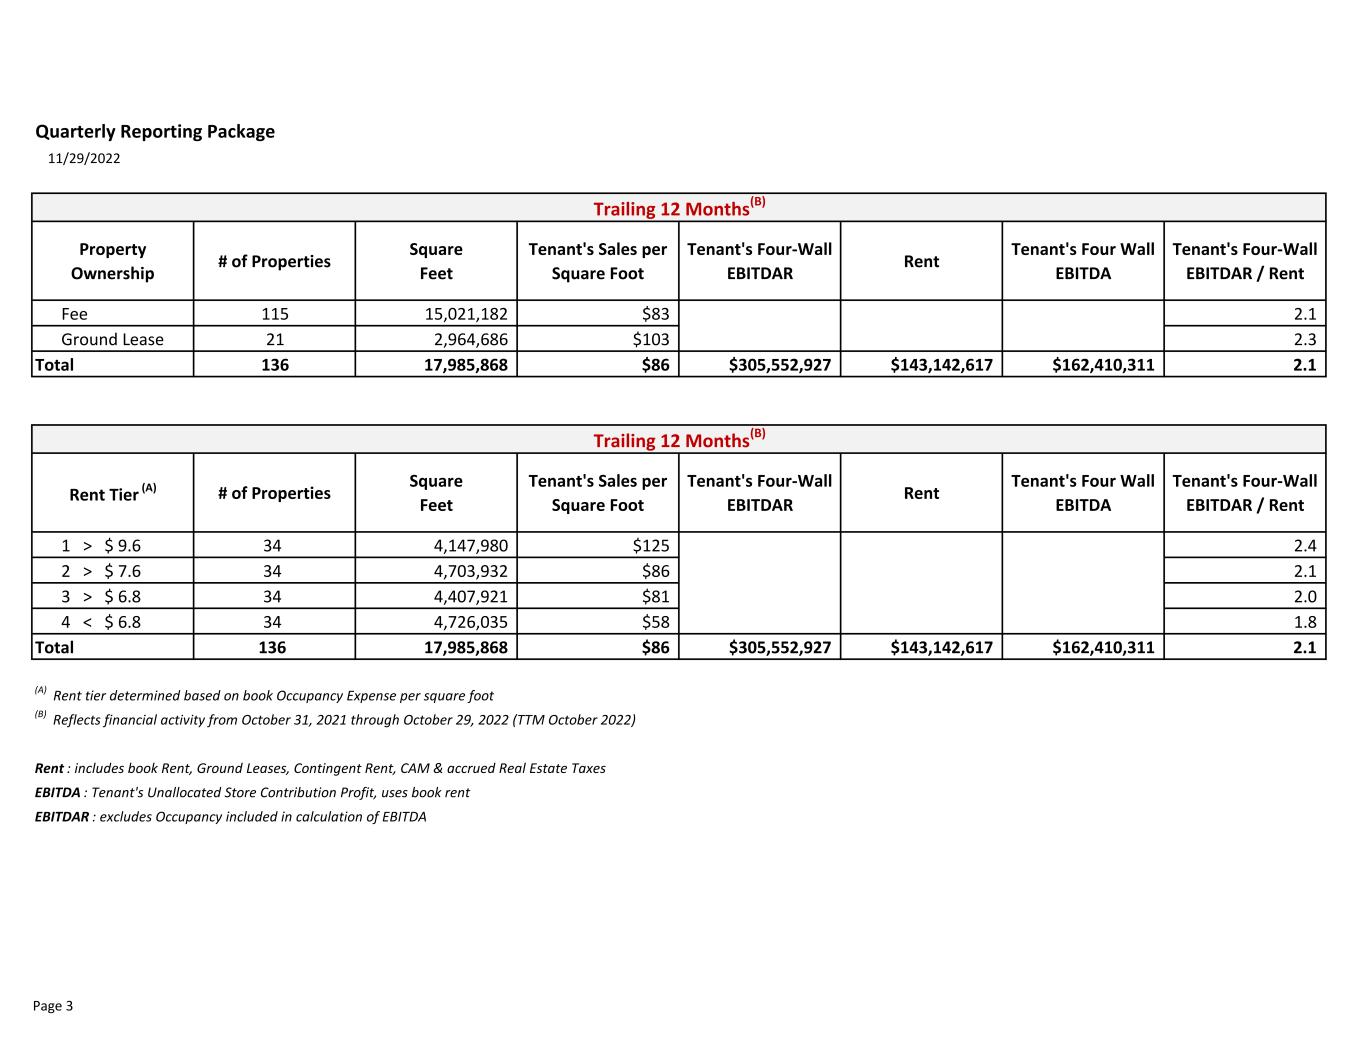
Quarterly Reporting Package 11/29/2022 Property Ownership # of Properties Square Feet Tenant's Sales per Square Foot Tenant's Four-Wall EBITDAR Rent Tenant's Four Wall EBITDA Tenant's Four-Wall EBITDAR / Rent Fee 115 15,021,182 $83 $240,555,355 $114,760,098 $125,795,257 2.1 Ground Lease 21 2,964,686 $103 $64,997,572 $28,382,519 $36,615,053 2.3 Total 136 17,985,868 $86 $305,552,927 $143,142,617 $162,410,311 2.1 Rent Tier (A) # of Properties Square Feet Tenant's Sales per Square Foot Tenant's Four-Wall EBITDAR Rent Tenant's Four Wall EBITDA Tenant's Four-Wall EBITDAR / Rent 1 > $ 9.6 34 4,147,980 $125 $116,153,609 $48,421,954 2.4 2 > $ 7.6 34 4,703,932 $86 $82,987,095 $39,581,092 2.1 3 > $ 6.8 34 4,407,921 $81 $65,224,294 $32,000,556 2.0 4 < $ 6.8 34 4,726,035 $58 $41,187,930 $23,139,014 1.8 Total 136 17,985,868 $86 $305,552,927 $143,142,617 $162,410,311 2.1 (A) Rent tier determined based on book Occupancy Expense per square foot (B) Reflects financial activity from October 31, 2021 through October 29, 2022 (TTM October 2022) Rent : includes book Rent, Ground Leases, Contingent Rent, CAM & accrued Real Estate Taxes EBITDA : Tenant's Unallocated Store Contribution Profit, uses book rent EBITDAR : excludes Occupancy included in calculation of EBITDA Trailing 12 Months(B) Trailing 12 Months(B) Page 3
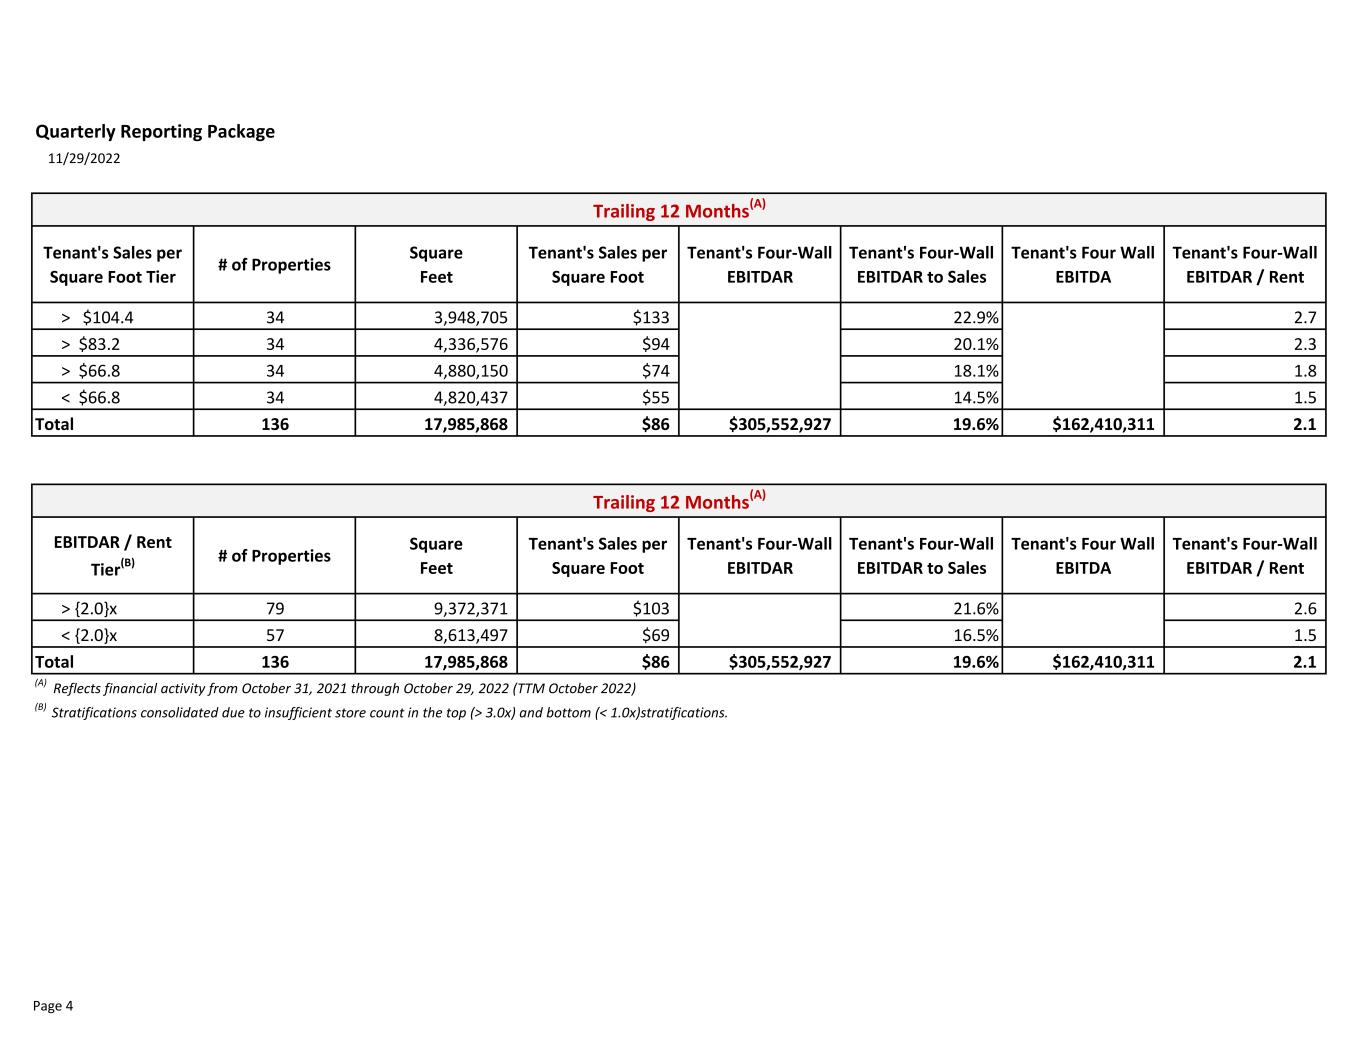
Quarterly Reporting Package 11/29/2022 Tenant's Sales per Square Foot Tier # of Properties Square Feet Tenant's Sales per Square Foot Tenant's Four-Wall EBITDAR Tenant's Four-Wall EBITDAR to Sales Tenant's Four Wall EBITDA Tenant's Four-Wall EBITDAR / Rent > $104.4 34 3,948,705 $133 22.9% 2.7 > $83.2 34 4,336,576 $94 20.1% 2.3 > $66.8 34 4,880,150 $74 18.1% 1.8 < $66.8 34 4,820,437 $55 14.5% 1.5 Total 136 17,985,868 $86 $305,552,927 19.6% $162,410,311 2.1 EBITDAR / Rent Tier(B) # of Properties Square Feet Tenant's Sales per Square Foot Tenant's Four-Wall EBITDAR Tenant's Four-Wall EBITDAR to Sales Tenant's Four Wall EBITDA Tenant's Four-Wall EBITDAR / Rent > {2.0}x 79 9,372,371 $103 21.6% 2.6 < {2.0}x 57 8,613,497 $69 16.5% 1.5 Total 136 17,985,868 $86 $305,552,927 19.6% $162,410,311 2.1 (A) Reflects financial activity from October 31, 2021 through October 29, 2022 (TTM October 2022) (B) Stratifications consolidated due to insufficient store count in the top (> 3.0x) and bottom (< 1.0x)stratifications. Trailing 12 Months(A) Trailing 12 Months(A) Page 4
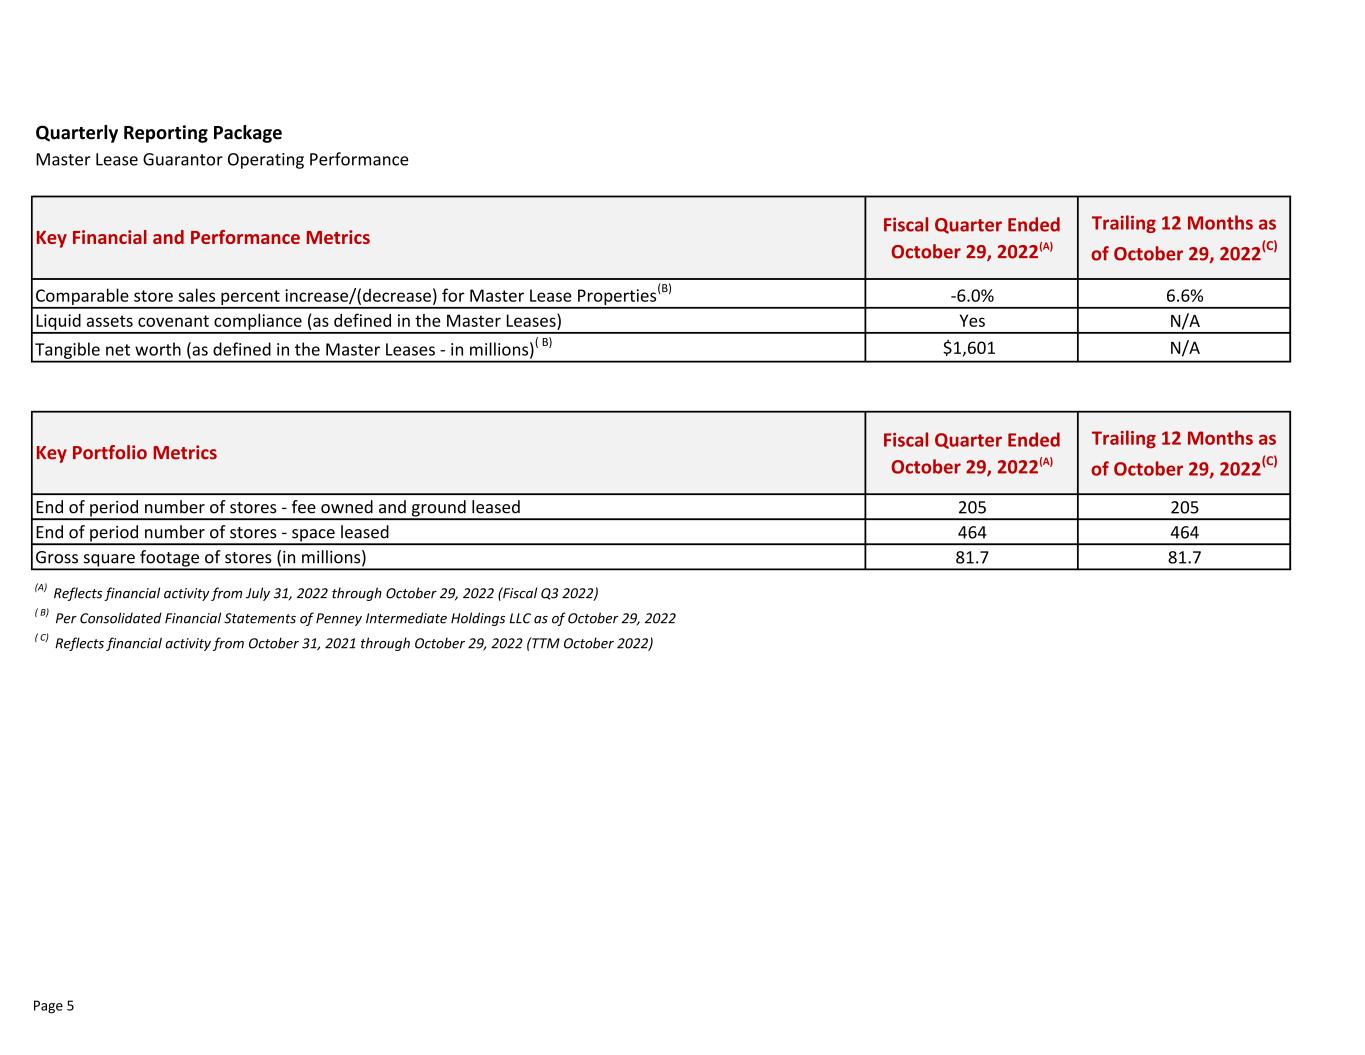
Quarterly Reporting Package Master Lease Guarantor Operating Performance Fiscal Quarter Ended October 29, 2022(A) Trailing 12 Months as of October 29, 2022(C) -6.0% 6.6% Yes N/A $1,601 N/A Fiscal Quarter Ended October 29, 2022(A) Trailing 12 Months as of October 29, 2022(C) 205 205 464 464 81.7 81.7 (A) Reflects financial activity from July 31, 2022 through October 29, 2022 (Fiscal Q3 2022) ( B) Per Consolidated Financial Statements of Penney Intermediate Holdings LLC as of October 29, 2022 ( C) Reflects financial activity from October 31, 2021 through October 29, 2022 (TTM October 2022) End of period number of stores - space leased Gross square footage of stores (in millions) Key Financial and Performance Metrics Comparable store sales percent increase/(decrease) for Master Lease Properties (B) Liquid assets covenant compliance (as defined in the Master Leases) Tangible net worth (as defined in the Master Leases - in millions)( B) Key Portfolio Metrics End of period number of stores - fee owned and ground leased Page 5
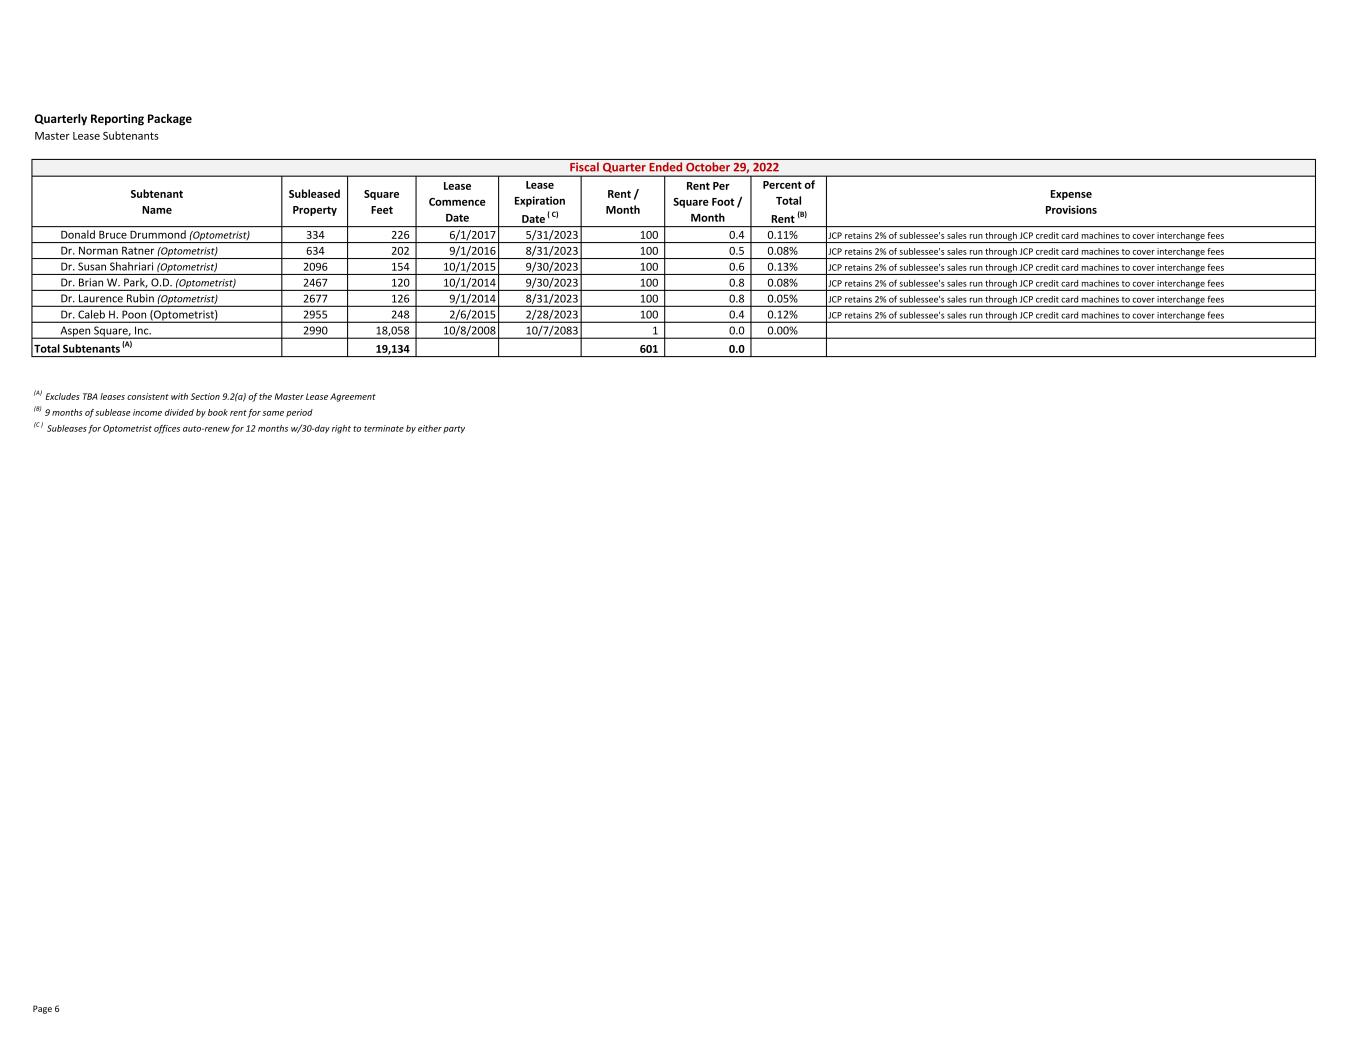
Quarterly Reporting Package Master Lease Subtenants Subtenant Name Subleased Property Square Feet Lease Commence Date Lease Expiration Date ( C) Rent / Month Rent Per Square Foot / Month Percent of Total Rent (B) Expense Provisions Donald Bruce Drummond (Optometrist) 334 226 6/1/2017 5/31/2023 100 0.4 0.11% JCP retains 2% of sublessee's sales run through JCP credit card machines to cover interchange fees Dr. Norman Ratner (Optometrist) 634 202 9/1/2016 8/31/2023 100 0.5 0.08% JCP retains 2% of sublessee's sales run through JCP credit card machines to cover interchange fees Dr. Susan Shahriari (Optometrist) 2096 154 10/1/2015 9/30/2023 100 0.6 0.13% JCP retains 2% of sublessee's sales run through JCP credit card machines to cover interchange fees Dr. Brian W. Park, O.D. (Optometrist) 2467 120 10/1/2014 9/30/2023 100 0.8 0.08% JCP retains 2% of sublessee's sales run through JCP credit card machines to cover interchange fees Dr. Laurence Rubin (Optometrist) 2677 126 9/1/2014 8/31/2023 100 0.8 0.05% JCP retains 2% of sublessee's sales run through JCP credit card machines to cover interchange fees Dr. Caleb H. Poon (Optometrist) 2955 248 2/6/2015 2/28/2023 100 0.4 0.12% JCP retains 2% of sublessee's sales run through JCP credit card machines to cover interchange fees Aspen Square, Inc. 2990 18,058 10/8/2008 10/7/2083 1 0.0 0.00% Total Subtenants (A) 19,134 601 0.0 (A) Excludes TBA leases consistent with Section 9.2(a) of the Master Lease Agreement (B) 9 months of sublease income divided by book rent for same period (C ) Subleases for Optometrist offices auto-renew for 12 months w/30-day right to terminate by either party Fiscal Quarter Ended October 29, 2022 Page 6